Infrastructure as Code Contracts in London

Infrastructure as Code (IaC, Infra as Code)
England > London

The table below provides summary statistics for contract job vacancies advertised in London requiring Infrastructure as Code skills. It includes a benchmarking guide to the contractor rates offered in vacancies that cited Infrastructure as Code over the 6 months leading up to 6 July 2025, comparing them to the same period in the previous two years.

6 months to
6 Jul 2025
Same period 2024 Same period 2023
Rank 55 100 93
Rank change year-on-year +45 -7 +11
Contract jobs citing Infrastructure as Code 598 434 710
As % of all contract jobs advertised in London 4.50% 2.47% 2.76%
As % of the Processes & Methodologies category 4.88% 2.79% 3.04%
Number of daily rates quoted 382 305 507
10th Percentile £390 £376 £453
25th Percentile £438 £463 £511
Median daily rate (50th Percentile) £550 £550 £600
Median % change year-on-year - -8.33% -2.04%
75th Percentile £675 £660 £700
90th Percentile £750 £749 £794
England median daily rate £544 £550 £600
% change year-on-year -1.09% -8.33% -
Number of hourly rates quoted 2 1 5
10th Percentile £53.95 - £29.30
25th Percentile £55.38 - £61.25
Median hourly rate £59.25 £55.00 £85.00
Median % change year-on-year +7.73% -35.29% +11.11%
75th Percentile £61.63 - £90.00
90th Percentile £62.15 - -
England median hourly rate £62.50 £68.44 £78.00
% change year-on-year -8.68% -12.26% +1.96%

All Process and Methodology Skills
London

Infrastructure as Code falls under the Processes and Methodologies category. For comparison with the information above, the following table provides summary statistics for all contract job vacancies requiring process or methodology skills in London.

Contract vacancies with a requirement for process or methodology skills 12,246 15,579 23,323
As % of all contract IT jobs advertised in London 92.17% 88.54% 90.71%
Number of daily rates quoted 8,177 11,085 16,913
10th Percentile £331 £340 £370
25th Percentile £425 £445 £470
Median daily rate (50th Percentile) £550 £550 £585
Median % change year-on-year - -5.98% +1.74%
75th Percentile £675 £680 £700
90th Percentile £799 £800 £800
England median daily rate £515 £525 £550
% change year-on-year -1.90% -4.55% -
Number of hourly rates quoted 226 294 268
10th Percentile £16.50 £15.96 £18.50
25th Percentile £24.66 £20.02 £23.00
Median hourly rate £32.00 £30.00 £40.77
Median % change year-on-year +6.67% -26.42% +13.25%
75th Percentile £50.50 £48.75 £65.00
90th Percentile £63.75 £68.75 £82.50
England median hourly rate £25.15 £38.12 £39.55
% change year-on-year -34.02% -3.62% +54.01%

Infrastructure as Code
Job Vacancy Trend in London

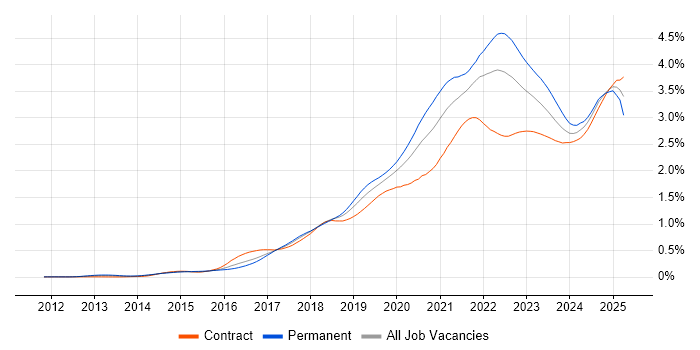
Job postings citing Infrastructure as Code as a proportion of all IT jobs advertised in London.

Job vacancy trend for Infrastructure as Code in London

Infrastructure as Code
Contractor Daily Rate Trend in London

3-month moving average daily rate quoted in jobs citing Infrastructure as Code in London.

Daily rate trend for Infrastructure as Code in London

Infrastructure as Code
Daily Rate Histogram in London

Daily rate distribution for jobs citing Infrastructure as Code in London over the 6 months to 6 July 2025.

Daily rate histogram for Infrastructure as Code in London

Infrastructure as Code
Contractor Hourly Rate Trend in London

3-month moving average hourly rates quoted in jobs citing Infrastructure as Code in London.

Hourly rate trend for Infrastructure as Code in London

Infrastructure as Code
Contract Job Locations in London

The table below looks at the demand and provides a guide to the median contractor rates quoted in IT jobs citing Infrastructure as Code within the London region over the 6 months to 6 July 2025. The 'Rank Change' column provides an indication of the change in demand within each location based on the same 6 month period last year.

Location Rank Change
on Same Period
Last Year
Matching
Contract
IT Job Ads
Median
Daily Rate
Past 6 Months
Median Daily Rate
% Change
on Same Period
Last Year
Live
Jobs
Central London +26 81 £625 +13.64% 275
South London -1 6 £495 +33.78% 5
West London +10 5 £495 +7.03% 10
East London +16 3 - - 19
North London - 1 £413 -
Infrastructure as Code
England

Infrastructure as Code
Co-occurring Skills and Capabilities in London by Category

The follow tables expand on the table above by listing co-occurrences grouped by category. The same employment type, locality and period is covered with up to 20 co-occurrences shown in each of the following categories:

Application Platforms
1 22 (3.68%) Apache Airflow
2 17 (2.84%) Apache Spark
3 12 (2.01%) Apache
4 10 (1.67%) Confluence
5 3 (0.50%) Microsoft Exchange
5 3 (0.50%) SharePoint
6 2 (0.33%) IIS
6 2 (0.33%) JBoss
6 2 (0.33%) Jupyter
6 2 (0.33%) OpenStack
7 1 (0.17%) Anypoint
7 1 (0.17%) Apache Superset
7 1 (0.17%) Camunda
7 1 (0.17%) CMS
7 1 (0.17%) DataSynapse
7 1 (0.17%) Headless CMS
7 1 (0.17%) Mule
7 1 (0.17%) nginx
7 1 (0.17%) Tomcat
7 1 (0.17%) WebLogic
Applications
1 2 (0.33%) Chatbot
1 2 (0.33%) Microsoft Office
2 1 (0.17%) Microsoft Excel
2 1 (0.17%) Microsoft PowerPoint
Business Applications
1 6 (1.00%) Shopify
2 2 (0.33%) Aladdin
2 2 (0.33%) Endur
2 2 (0.33%) Fidessa
2 2 (0.33%) thinkFolio
3 1 (0.17%) Dynamics CRM
3 1 (0.17%) Oracle EBS
Cloud Services
1 320 (53.51%) AWS
2 302 (50.50%) Azure
3 129 (21.57%) GCP
4 125 (20.90%) GitHub
5 112 (18.73%) Azure DevOps
6 111 (18.56%) Serverless
7 92 (15.38%) AWS CloudFormation
8 74 (12.37%) GitHub Actions
9 57 (9.53%) AWS Lambda
10 50 (8.36%) PaaS
11 49 (8.19%) Azure AKS
12 48 (8.03%) Azure Monitor
13 47 (7.86%) Amazon S3
14 42 (7.02%) Entra ID
15 38 (6.35%) IaaS
16 36 (6.02%) Amazon EC2
16 36 (6.02%) Amazon EKS
17 33 (5.52%) SaaS
18 28 (4.68%) Azure ExpressRoute
18 28 (4.68%) OpenShift
Communications & Networking
1 71 (11.87%) Firewall
2 54 (9.03%) DNS
3 46 (7.69%) VPN
4 28 (4.68%) Network Security
5 21 (3.51%) TCP/IP
6 16 (2.68%) NGFW
7 14 (2.34%) HTTP
8 9 (1.51%) DHCP
8 9 (1.51%) Internet
9 6 (1.00%) Kerberos
9 6 (1.00%) SSL
10 5 (0.84%) SSH
11 4 (0.67%) HTTPS
11 4 (0.67%) NAS
11 4 (0.67%) Remote Desktop
11 4 (0.67%) SAN
11 4 (0.67%) Wireshark
12 3 (0.50%) Multicast
12 3 (0.50%) SNMP
12 3 (0.50%) WAN
Database & Business Intelligence
1 40 (6.69%) Amazon RDS
2 25 (4.18%) Data Lake
3 24 (4.01%) NoSQL
4 23 (3.85%) PostgreSQL
5 20 (3.34%) DynamoDB
6 18 (3.01%) Big Data
7 17 (2.84%) Power BI
8 16 (2.68%) SQL Server
9 14 (2.34%) BigQuery
9 14 (2.34%) Data Warehouse
10 13 (2.17%) Amazon Aurora
10 13 (2.17%) Azure SQL Database
11 12 (2.01%) Amazon Redshift
12 11 (1.84%) Amazon Athena
12 11 (1.84%) Relational Database
13 8 (1.34%) Delta Lake
14 7 (1.17%) Elasticsearch
14 7 (1.17%) MongoDB
14 7 (1.17%) Redis
15 5 (0.84%) Tableau
Development Applications
1 103 (17.22%) Jenkins
2 86 (14.38%) GitLab
3 66 (11.04%) Git
4 31 (5.18%) SonarQube
5 21 (3.51%) JIRA
6 17 (2.84%) CircleCI
7 14 (2.34%) Burp Suite
7 14 (2.34%) Metasploit
8 8 (1.34%) TeamCity
9 7 (1.17%) Artifactory
9 7 (1.17%) Atlassian Bamboo
9 7 (1.17%) Terragrunt
10 5 (0.84%) Maven
11 4 (0.67%) Bitbucket
12 3 (0.50%) JMeter
12 3 (0.50%) MLflow
12 3 (0.50%) Sonatype Nexus
13 2 (0.33%) Gradle
13 2 (0.33%) Selenium
14 1 (0.17%) Robot Framework
General
1 166 (27.76%) Social Skills
2 104 (17.39%) Finance
3 57 (9.53%) Public Sector
4 52 (8.70%) Analytical Skills
5 46 (7.69%) Banking
6 16 (2.68%) Presentation Skills
7 12 (2.01%) Investment Banking
8 11 (1.84%) Inclusion and Diversity
8 11 (1.84%) Marketing
8 11 (1.84%) Retail
9 9 (1.51%) Telecoms
10 8 (1.34%) Documentation Skills
10 8 (1.34%) Financial Institution
10 8 (1.34%) Military
11 7 (1.17%) Law
12 6 (1.00%) Publishing
13 4 (0.67%) Legal
14 3 (0.50%) Billing
14 3 (0.50%) Influencing Skills
14 3 (0.50%) Multimedia
Job Titles
1 116 (19.40%) DevOps Engineer
2 107 (17.89%) Senior
3 90 (15.05%) Architect
4 73 (12.21%) Azure Engineer
5 67 (11.20%) AWS Engineer
6 58 (9.70%) Cloud Engineer
7 56 (9.36%) Developer
8 51 (8.53%) Platform Engineer
9 40 (6.69%) Data Engineer
10 38 (6.35%) AWS DevOps
11 35 (5.85%) Lead
12 32 (5.35%) AWS DevOps Engineer
13 30 (5.02%) Azure Architect
14 28 (4.68%) Cloud Architect
15 27 (4.52%) Site Reliability Engineer
16 26 (4.35%) Security Engineer
16 26 (4.35%) Site Engineer
17 25 (4.18%) Cloud Platform Engineer
17 25 (4.18%) Senior DevOps
18 24 (4.01%) Senior DevOps Engineer
Libraries, Frameworks & Software Standards
1 46 (7.69%) ARM Templates
2 44 (7.36%) .NET
3 29 (4.85%) Kafka
4 28 (4.68%) Elastic Stack
5 26 (4.35%) ADO
5 26 (4.35%) React
6 23 (3.85%) Node.js
7 22 (3.68%) OpenTelemetry
8 21 (3.51%) RESTful
8 21 (3.51%) YAML
9 19 (3.18%) AWS CDK
9 19 (3.18%) REST
10 18 (3.01%) JSON
11 17 (2.84%) .NET Framework
12 13 (2.17%) AngularJS
12 13 (2.17%) GraphQL
12 13 (2.17%) Spring
13 12 (2.01%) Jinja
14 11 (1.84%) Entity Framework
14 11 (1.84%) OAuth
Miscellaneous
1 106 (17.73%) Cloud Native
2 40 (6.69%) Public Cloud
3 31 (5.18%) Distributed Systems
4 21 (3.51%) Hybrid Cloud
5 17 (2.84%) Data Protection Act
6 16 (2.68%) Anti-Spyware
6 16 (2.68%) Product Ownership
7 11 (1.84%) Data Centre
8 9 (1.51%) Greenfield Project
8 9 (1.51%) Linux Command Line
9 8 (1.34%) Enterprise Cloud
9 8 (1.34%) Onboarding
10 7 (1.17%) Legacy Systems
10 7 (1.17%) PKI
11 6 (1.00%) Hedge funds
11 6 (1.00%) Legacy Applications
11 6 (1.00%) Management Information System
11 6 (1.00%) Security Posture
12 5 (0.84%) Enterprise Software
12 5 (0.84%) Reinsurance
Operating Systems
1 90 (15.05%) Linux
2 23 (3.85%) Windows
3 16 (2.68%) Windows Server
4 15 (2.51%) Red Hat Enterprise Linux
5 12 (2.01%) Unix
6 9 (1.51%) VMS
7 3 (0.50%) Rocky
7 3 (0.50%) Solaris
8 2 (0.33%) SUSE
8 2 (0.33%) Windows Server 2016
9 1 (0.17%) Debian
9 1 (0.17%) Oracle Linux
9 1 (0.17%) Ubuntu
9 1 (0.17%) Windows 10
9 1 (0.17%) Windows Server 2019
Processes & Methodologies
1 372 (62.21%) CI/CD
2 351 (58.70%) DevOps
3 173 (28.93%) Containerisation
4 145 (24.25%) Agile
5 133 (22.24%) Problem-Solving
6 85 (14.21%) Cloud Security
6 85 (14.21%) Microservices
6 85 (14.21%) Migration
7 83 (13.88%) Observability
8 78 (13.04%) Infrastructure Automation
9 74 (12.37%) Configuration Management
10 63 (10.54%) Mentoring
10 63 (10.54%) Test Automation
11 61 (10.20%) Analytics
12 58 (9.70%) Platform Engineering
13 57 (9.53%) Software Engineering
14 56 (9.36%) Continuous Integration
14 56 (9.36%) High Availability
15 55 (9.20%) Site Reliability Engineering
16 48 (8.03%) DevSecOps
Programming Languages
1 298 (49.83%) Python
2 112 (18.73%) Bash
3 99 (16.56%) SQL
4 97 (16.22%) PowerShell
5 82 (13.71%) Java
6 68 (11.37%) Bicep
7 54 (9.03%) Go
8 52 (8.70%) C#
9 47 (7.86%) JavaScript
10 33 (5.52%) TypeScript
11 10 (1.67%) Kotlin
11 10 (1.67%) Shell Script
12 9 (1.51%) Kusto Query Language
12 9 (1.51%) PL/SQL
12 9 (1.51%) RPG
13 8 (1.34%) Groovy
13 8 (1.34%) RPG IV
13 8 (1.34%) Scala
14 7 (1.17%) Perl
15 5 (0.84%) Ruby
Qualifications
1 134 (22.41%) Security Cleared
2 110 (18.39%) SC Cleared
3 35 (5.85%) AWS Certification
4 28 (4.68%) Azure Certification
4 28 (4.68%) Degree
5 15 (2.51%) AWS Certified Solutions Architect
6 14 (2.34%) CREST Certified
6 14 (2.34%) DV Cleared
6 14 (2.34%) OSCP
7 13 (2.17%) Tigerscheme
8 11 (1.84%) Computer Science Degree
9 10 (1.67%) CHECK Team Member
10 9 (1.51%) AWS Certified DevOps Engineer
11 5 (0.84%) AWS Certified Developer
11 5 (0.84%) Cisco Certification
11 5 (0.84%) CISSP
12 4 (0.67%) CCIE
12 4 (0.67%) Microsoft Certification
12 4 (0.67%) OCP
12 4 (0.67%) Oracle Certification
Quality Assurance & Compliance
1 31 (5.18%) GDPR
2 24 (4.01%) Data Quality
3 19 (3.18%) ISO/IEC 27001
4 16 (2.68%) NIST
5 15 (2.51%) QA
6 11 (1.84%) HIPAA
6 11 (1.84%) NCSC
6 11 (1.84%) SOC 2
7 10 (1.67%) Cyber Essentials
7 10 (1.67%) Cyber Essentials PLUS
8 7 (1.17%) PCI DSS
9 5 (0.84%) SLA
10 3 (0.50%) Accessibility
11 2 (0.33%) MiFID
11 2 (0.33%) Sarbanes-Oxley
12 1 (0.17%) 21 CFR Part 11
12 1 (0.17%) California Consumer Privacy Act
12 1 (0.17%) FedRAMP
12 1 (0.17%) GxP
System Software
1 176 (29.43%) Docker
2 35 (5.85%) Active Directory
3 17 (2.84%) Virtual Machines
4 7 (1.17%) VMware Infrastructure
5 4 (0.67%) iptables
6 3 (0.50%) FreeRADIUS
6 3 (0.50%) Hyper-V
7 2 (0.33%) VMware ESXi
7 2 (0.33%) vSphere
7 2 (0.33%) zsh
8 1 (0.17%) Ceph
8 1 (0.17%) Lustre
8 1 (0.17%) Snort
8 1 (0.17%) Squid
8 1 (0.17%) Tivoli Workload Scheduler
8 1 (0.17%) Virtual Desktop
8 1 (0.17%) VMware NSX
8 1 (0.17%) XenApp
Systems Management
1 445 (74.41%) Terraform
2 278 (46.49%) Kubernetes
3 137 (22.91%) Ansible
4 75 (12.54%) Grafana
5 74 (12.37%) Prometheus
6 39 (6.52%) Puppet
7 27 (4.52%) Progress Chef
8 14 (2.34%) Argo
8 14 (2.34%) Nmap
8 14 (2.34%) Single Sign-On
9 11 (1.84%) Rancher
10 10 (1.67%) Microsoft Intune
11 9 (1.51%) Podman
12 5 (0.84%) Packer
13 4 (0.67%) Istio
13 4 (0.67%) Kibana
13 4 (0.67%) logstash
13 4 (0.67%) Nessus
13 4 (0.67%) Netcool
13 4 (0.67%) ZABBIX
Vendors
1 86 (14.38%) Microsoft
2 45 (7.53%) Google
3 29 (4.85%) Databricks
4 24 (4.01%) Splunk
5 22 (3.68%) Palo Alto
6 20 (3.34%) Red Hat
7 18 (3.01%) CheckPoint
8 16 (2.68%) Infoblox
9 14 (2.34%) Veracode
10 12 (2.01%) Cisco
10 12 (2.01%) VMware
11 11 (1.84%) Oracle
12 9 (1.51%) SAP
13 8 (1.34%) Cloudera
14 7 (1.17%) Salesforce
14 7 (1.17%) ServiceNow
15 6 (1.00%) Adobe
15 6 (1.00%) CyberArk
15 6 (1.00%) Okta
15 6 (1.00%) OpenAI