nginx Jobs in England

nginx
UK > England

The table below provides summary statistics for permanent job vacancies advertised in England requiring nginx skills. It includes a benchmarking guide to the annual salaries offered in vacancies that cited nginx over the 6 months leading up to 26 July 2024, comparing them to the same period in the previous two years.

6 months to
26 Jul 2024
Same period 2023 Same period 2022
Rank 647 684 805
Rank change year-on-year +37 +121 -249
Permanent jobs citing nginx 153 150 405
As % of all permanent jobs advertised in England 0.20% 0.21% 0.28%
As % of the Application Platforms category 2.08% 1.89% 2.01%
Number of salaries quoted 98 116 133
10th Percentile £35,000 £41,250 £32,500
25th Percentile £48,750 £52,500 £47,500
Median annual salary (50th Percentile) £70,000 £65,000 £55,000
Median % change year-on-year +7.69% +18.18% +4.76%
75th Percentile £87,500 £77,715 £75,000
90th Percentile - £87,500 £95,000
UK median annual salary £66,250 £65,000 £60,000
% change year-on-year +1.92% +8.33% +14.29%

All Application Platform Skills
England

nginx falls under the Application Platforms category. For comparison with the information above, the following table provides summary statistics for all permanent job vacancies requiring application platform skills in England.

Permanent vacancies with a requirement for application platform skills 7,350 7,935 20,123
As % of all permanent jobs advertised in England 9.38% 11.16% 13.69%
Number of salaries quoted 5,299 6,228 10,569
10th Percentile £29,000 £31,250 £30,000
25th Percentile £37,500 £40,000 £39,750
Median annual salary (50th Percentile) £52,500 £57,500 £55,000
Median % change year-on-year -8.70% +4.55% +4.76%
75th Percentile £80,000 £77,500 £75,000
90th Percentile £122,500 £95,000 £94,400
UK median annual salary £52,500 £55,834 £55,000
% change year-on-year -5.97% +1.52% +4.76%

nginx
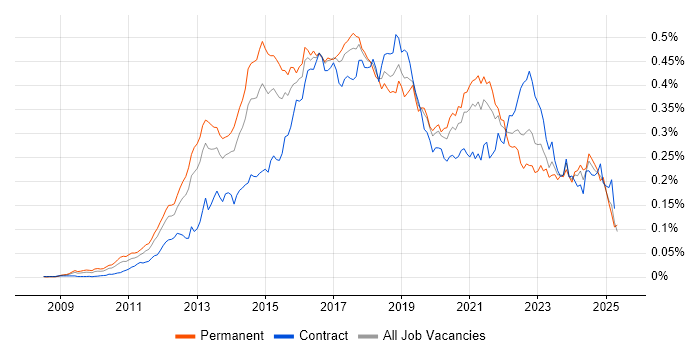
Job Vacancy Trend in England

Job postings citing nginx as a proportion of all IT jobs advertised in England.

Job vacancy trend for nginx in England

nginx
Salary Trend in England

3-month moving average salary quoted in jobs citing nginx in England.

Salary trend for nginx in England

nginx
Salary Histogram in England

Salary distribution for jobs citing nginx in England over the 6 months to 26 July 2024.

Salary histogram for nginx in England

nginx
Job Locations in England

The table below looks at the demand and provides a guide to the median salaries quoted in IT jobs citing nginx within the England region over the 6 months to 26 July 2024. The 'Rank Change' column provides an indication of the change in demand within each location based on the same 6 month period last year.

Location Rank Change
on Same Period
Last Year
Matching
Permanent
IT Job Ads
Median Salary
Past 6 Months
Median Salary
% Change
on Same Period
Last Year
Live
Jobs
South East +40 59 £60,000 +3.45% 2
London +59 48 £80,000 +15.20% 2
South West -5 21 £80,000 +15.20% 1
North of England -4 11 £52,500 -19.23% 8
North West -15 9 £52,500 -19.23% 2
West Midlands +3 8 £50,000 -24.53% 1
Midlands -14 8 £50,000 -24.53% 2
East of England -5 6 £40,000 -27.27% 1
Yorkshire +53 2 £51,500 -25.84%
nginx
UK

nginx
Co-occurring Skills and Capabilities in England by Category

The follow tables expand on the table above by listing co-occurrences grouped by category. The same employment type, locality and period is covered with up to 20 co-occurrences shown in each of the following categories:

Application Platforms
1 60 (39.22%) Apache
2 36 (23.53%) Camunda
3 16 (10.46%) Apache Spark
3 16 (10.46%) Jupyter
4 6 (3.92%) Confluence
4 6 (3.92%) JBoss
5 5 (3.27%) Apache Solr
5 5 (3.27%) IIS
6 4 (2.61%) Microsoft Exchange
7 3 (1.96%) Exchange Server 2013
7 3 (1.96%) SharePoint
7 3 (1.96%) Tomcat
8 2 (1.31%) SharePoint Server
8 2 (1.31%) WordPress
9 1 (0.65%) CMS
9 1 (0.65%) Headless CMS
Cloud Services
1 59 (38.56%) OpenShift
2 52 (33.99%) AWS
3 35 (22.88%) IBM Cloud
4 34 (22.22%) Azure
5 29 (18.95%) GCP
6 25 (16.34%) Amazon S3
7 19 (12.42%) MinIO
8 14 (9.15%) GitHub
9 13 (8.50%) Datadog
10 11 (7.19%) GitHub Actions
10 11 (7.19%) npm
11 7 (4.58%) Cloudflare
11 7 (4.58%) Serverless
12 6 (3.92%) Amazon EC2
12 6 (3.92%) Virtual Private Cloud
12 6 (3.92%) Yarn
13 5 (3.27%) Amazon ELB
13 5 (3.27%) Azure AKS
14 4 (2.61%) Azure Monitor
14 4 (2.61%) ChatGPT
Communications & Networking
1 11 (7.19%) TCP/IP
2 10 (6.54%) SSL
3 9 (5.88%) Reverse Proxy
4 8 (5.23%) DNS
5 7 (4.58%) HTTP
5 7 (4.58%) VPN
6 6 (3.92%) AMQP
6 6 (3.92%) SAN
7 5 (3.27%) MQTT
8 3 (1.96%) Firewall
8 3 (1.96%) OpenVPN
8 3 (1.96%) Skype
9 2 (1.31%) DHCP
9 2 (1.31%) HTTPS
9 2 (1.31%) Internet
9 2 (1.31%) LAN
9 2 (1.31%) NAS
9 2 (1.31%) SMTP
9 2 (1.31%) SSH
9 2 (1.31%) WAN
Database & Business Intelligence
1 46 (30.07%) MongoDB
2 37 (24.18%) MySQL
3 36 (23.53%) Oracle Database
4 23 (15.03%) PostgreSQL
5 17 (11.11%) Big Data
5 17 (11.11%) Elasticsearch
6 16 (10.46%) Hadoop
6 16 (10.46%) Presto
7 13 (8.50%) Redis
8 9 (5.88%) MariaDB
8 9 (5.88%) Relational Database
9 8 (5.23%) Amazon RDS
10 6 (3.92%) Amazon Aurora
10 6 (3.92%) GIS
10 6 (3.92%) NoSQL
11 4 (2.61%) Azure SQL Database
11 4 (2.61%) SQL Server
11 4 (2.61%) Squirro
12 3 (1.96%) DynamoDB
13 2 (1.31%) Power BI
Development Applications
1 38 (24.84%) Git
2 31 (20.26%) Jenkins
3 16 (10.46%) Atlassian Bamboo
4 14 (9.15%) JIRA
5 9 (5.88%) Bitbucket
5 9 (5.88%) webpack
6 8 (5.23%) GitLab
7 6 (3.92%) Cypress.io
7 6 (3.92%) Mocha
7 6 (3.92%) PHPUnit
8 5 (3.27%) Maven
8 5 (3.27%) TeamCity
9 4 (2.61%) Octopus Deploy
10 3 (1.96%) Selenium
10 3 (1.96%) SonarQube
10 3 (1.96%) Subversion
11 2 (1.31%) Cucumber
11 2 (1.31%) GNU Toolchain
11 2 (1.31%) JUnit
11 2 (1.31%) Postman
General
1 43 (28.10%) Public Sector
2 35 (22.88%) Inclusion and Diversity
3 33 (21.57%) Social Skills
4 32 (20.92%) Finance
5 9 (5.88%) Analytical Skills
5 9 (5.88%) Telecoms
6 8 (5.23%) Manufacturing
7 7 (4.58%) Banking
7 7 (4.58%) Marketing
8 6 (3.92%) Electronics
8 6 (3.92%) Organisational Skills
8 6 (3.92%) Retail
9 3 (1.96%) Financial Institution
9 3 (1.96%) Games
9 3 (1.96%) Legal
10 2 (1.31%) Military
11 1 (0.65%) Advertising
11 1 (0.65%) Cantonese Language
11 1 (0.65%) Mandarin Language
11 1 (0.65%) Retail Banking
Job Titles
1 49 (32.03%) Developer
2 36 (23.53%) Full Stack Engineer
3 30 (19.61%) DevOps Engineer
4 28 (18.30%) Senior
5 22 (14.38%) PHP Developer
5 22 (14.38%) Senior Developer
6 17 (11.11%) Data Engineer
7 16 (10.46%) Big Data Engineer
8 13 (8.50%) Backend Developer
8 13 (8.50%) Full Stack Developer
9 11 (7.19%) Linux Engineer
9 11 (7.19%) Senior Backend Developer
10 7 (4.58%) Senior Full Stack Developer
10 7 (4.58%) Senior PHP Developer
10 7 (4.58%) Software Engineer
11 6 (3.92%) Geospatial Engineer
11 6 (3.92%) PHP Web Developer
11 6 (3.92%) Senior PHP Web Developer
11 6 (3.92%) Senior Web Developer
11 6 (3.92%) Web Developer
Libraries, Frameworks & Software Standards
1 87 (56.86%) React
2 55 (35.95%) Node.js
3 38 (24.84%) HTML
3 38 (24.84%) Swagger
4 37 (24.18%) CSS
5 36 (23.53%) KeystoneJS
6 32 (20.92%) RabbitMQ
7 31 (20.26%) LEMP Stack
8 21 (13.73%) HTML5
8 21 (13.73%) LAMP
9 20 (13.07%) Elastic Stack
10 19 (12.42%) REST
11 17 (11.11%) YAML
12 16 (10.46%) ActiveMQ
12 16 (10.46%) Apache NiFi
12 16 (10.46%) CSS3
13 14 (9.15%) OAuth
14 13 (8.50%) .NET
14 13 (8.50%) Flask
14 13 (8.50%) OAuth2
Miscellaneous
1 51 (33.33%) Hybrid Cloud
2 35 (22.88%) Blockchain
2 35 (22.88%) e-Learning
3 10 (6.54%) Mobile App
4 9 (5.88%) Product Ownership
5 7 (4.58%) Greenfield Project
6 6 (3.92%) Data Centre
7 5 (3.27%) IoT
7 5 (3.27%) Self-Motivation
8 4 (2.61%) Cloud Native
9 3 (1.96%) Foreign Exchange (FX)
9 3 (1.96%) Mobile Games
9 3 (1.96%) Public Cloud
10 2 (1.31%) Client/Server
10 2 (1.31%) Embedded Systems
10 2 (1.31%) FPGA
10 2 (1.31%) iPhone
10 2 (1.31%) Life Science
10 2 (1.31%) Linux Command Line
10 2 (1.31%) PropTech
Operating Systems
1 96 (62.75%) Linux
2 12 (7.84%) Windows
3 10 (6.54%) Red Hat Enterprise Linux
4 9 (5.88%) Unix
5 6 (3.92%) CentOS
6 4 (2.61%) Alpine Linux
7 2 (1.31%) Oracle Linux
7 2 (1.31%) Ubuntu
7 2 (1.31%) Windows Server
8 1 (0.65%) Rocky
Processes & Methodologies
1 59 (38.56%) DevOps
2 52 (33.99%) Full Stack Development
3 50 (32.68%) CI/CD
4 48 (31.37%) Artificial Intelligence
5 44 (28.76%) SDLC
6 41 (26.80%) Customer Service
7 35 (22.88%) Coaching
7 35 (22.88%) Mentoring
8 34 (22.22%) Containerisation
9 33 (21.57%) Agile
9 33 (21.57%) Technology Transformation
10 32 (20.92%) Infrastructure as Code
11 27 (17.65%) Software Engineering
12 22 (14.38%) Observability
13 19 (12.42%) OOP
14 17 (11.11%) Business Intelligence
14 17 (11.11%) Microservices
14 17 (11.11%) Service Delivery
14 17 (11.11%) Site Reliability Engineering
15 16 (10.46%) Thought Leadership
Programming Languages
1 92 (60.13%) JavaScript
2 60 (39.22%) Python
3 54 (35.29%) Java
4 43 (28.10%) Bash
5 36 (23.53%) Lua
6 29 (18.95%) PHP
7 23 (15.03%) TypeScript
8 20 (13.07%) Shell Script
9 17 (11.11%) SQL
10 8 (5.23%) C#
11 6 (3.92%) Kotlin
11 6 (3.92%) PowerShell
12 5 (3.27%) JSX
12 5 (3.27%) R
12 5 (3.27%) Rust
13 4 (2.61%) Bicep
13 4 (2.61%) C
13 4 (2.61%) C++
14 3 (1.96%) Go
15 2 (1.31%) Ruby
Qualifications
1 23 (15.03%) Security Cleared
2 18 (11.76%) DV Cleared
3 9 (5.88%) Degree
4 6 (3.92%) Master's Degree
5 2 (1.31%) SC Cleared
6 1 (0.65%) CISSP
6 1 (0.65%) OSCP
6 1 (0.65%) RHCE
Quality Assurance & Compliance
1 6 (3.92%) QA
2 5 (3.27%) Cyber Essentials
2 5 (3.27%) ISO/IEC 27001
3 1 (0.65%) ISO 20022
System Software
1 98 (64.05%) Docker
2 9 (5.88%) VMware Infrastructure
3 7 (4.58%) Virtual Desktop
4 6 (3.92%) vSphere
5 4 (2.61%) Virtual Machines
6 3 (1.96%) Hyper-V
6 3 (1.96%) Varnish
7 2 (1.31%) Firmware
8 1 (0.65%) Active Directory
8 1 (0.65%) iptables
8 1 (0.65%) KVM
8 1 (0.65%) Xen
Systems Management
1 52 (33.99%) Kubernetes
2 42 (27.45%) Ansible
3 40 (26.14%) Terraform
4 36 (23.53%) Prometheus
5 28 (18.30%) Grafana
6 17 (11.11%) HAProxy
7 10 (6.54%) Nagios
8 9 (5.88%) Puppet
9 7 (4.58%) Active Directory Federation Services
10 6 (3.92%) Progress Chef
10 6 (3.92%) Single Sign-On
11 5 (3.27%) Istio
11 5 (3.27%) Red Hat Satellite
12 4 (2.61%) HP Data Protector
12 4 (2.61%) Packer
13 2 (1.31%) Kustomize
13 2 (1.31%) Rancher
13 2 (1.31%) Red Hat Spacewalk
14 1 (0.65%) Docker Swarm
14 1 (0.65%) Failover Clustering
Vendors
1 52 (33.99%) Red Hat
2 43 (28.10%) Oracle
3 36 (23.53%) IBM
4 17 (11.11%) Google
5 11 (7.19%) Atlassian
6 9 (5.88%) VMware
7 7 (4.58%) Splunk
8 6 (3.92%) Dell
8 6 (3.92%) HP
8 6 (3.92%) New Relic
8 6 (3.92%) SAP
9 5 (3.27%) F5
10 4 (2.61%) EMC
11 2 (1.31%) Imperva
12 1 (0.65%) Microsoft
12 1 (0.65%) SolarWinds
12 1 (0.65%) Veeam