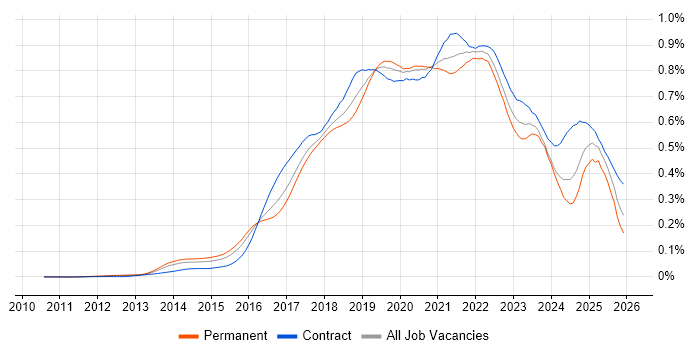
Bitbucket Job Trends in England

Bitbucket
UK > England

The table below provides summary statistics and salary benchmarking for jobs advertised in England requiring Bitbucket skills. It covers vacancies from the 6 months leading up to 18 September 2025, with comparisons to the same periods in the previous two years.

6 months to
18 Sep 2025
Same period 2024 Same period 2023
Rank 403 596 488
Rank change year-on-year +193 -108 -63
Permanent jobs citing Bitbucket 265 165 261
As % of all permanent jobs advertised in England 0.61% 0.24% 0.48%
As % of the Development Applications category 8.13% 2.80% 3.74%
Number of salaries quoted 42 99 220
10th Percentile £36,150 £40,000 £46,125
25th Percentile £49,188 £44,375 £54,750
Median annual salary (50th Percentile) £58,750 £56,500 £70,000
Median % change year-on-year +3.98% -19.29% +7.69%
75th Percentile £82,813 £72,500 £90,000
90th Percentile £117,000 £79,400 £112,500
UK median annual salary £57,500 £56,500 £70,000
% change year-on-year +1.77% -19.29% +7.69%

All Development Application Skills
England

Bitbucket falls under the Development Applications category. For comparison with the information above, the following table provides summary statistics for all permanent job vacancies requiring development application skills in England.

Permanent vacancies with a requirement for development application skills 3,261 5,896 6,986
As % of all permanent jobs advertised in England 7.55% 8.54% 12.95%
Number of salaries quoted 2,031 3,540 5,596
10th Percentile £36,250 £40,000 £42,500
25th Percentile £47,500 £46,250 £50,000
Median annual salary (50th Percentile) £62,500 £60,000 £65,000
Median % change year-on-year +4.17% -7.69% +3.84%
75th Percentile £80,000 £77,500 £82,500
90th Percentile £97,500 £95,000 £97,500
UK median annual salary £62,500 £60,000 £65,000
% change year-on-year +4.17% -7.69% +4.00%

Bitbucket
Job Vacancy Trend in England

Job postings citing Bitbucket as a proportion of all IT jobs advertised in England.

Job vacancy trend for Bitbucket in England

Bitbucket
Salary Trend in England

Salary distribution trend for jobs in England citing Bitbucket.

Salary distribution trend for jobs in England citing Bitbucket

Bitbucket
Salary Histogram in England

Salary distribution for jobs citing Bitbucket in England over the 6 months to 18 September 2025.

Salary histogram for Bitbucket in England

Bitbucket
Job Locations in England

The table below looks at the demand and provides a guide to the median salaries quoted in IT jobs citing Bitbucket within the England region over the 6 months to 18 September 2025. The 'Rank Change' column provides an indication of the change in demand within each location based on the same 6 month period last year.

Location Rank Change
on Same Period
Last Year
Matching
Permanent
IT Job Ads
Median Salary
Past 6 Months
Median Salary
% Change
on Same Period
Last Year
Live
Jobs
North of England +116 127 £52,500 -8.70% 25
North West +94 116 - - 19
Midlands +106 63 - - 6
East Midlands +71 39 - -
London +60 35 £80,000 +10.34% 19
West Midlands +64 24 - - 6
South East +32 17 £40,000 -11.11% 12
East of England -16 15 - - 2
North East +31 11 £52,500 +23.53% 6
South West +48 6 £52,000 -7.96% 6
Bitbucket
UK

Bitbucket
Co-occurring Skills and Capabilities in England by Category

The follow tables expand on the table above by listing co-occurrences grouped by category. The same employment type, locality and period is covered with up to 20 co-occurrences shown in each of the following categories:

Application Platforms
1 123 (46.42%) Confluence
2 4 (1.51%) Camunda
2 4 (1.51%) Tomcat
3 3 (1.13%) Apache
3 3 (1.13%) CMS
3 3 (1.13%) IIS
3 3 (1.13%) nginx
3 3 (1.13%) Umbraco
4 2 (0.75%) CICS
5 1 (0.38%) Mule
5 1 (0.38%) Oracle Coherence
5 1 (0.38%) Oracle SOA Suite
Applications
1 1 (0.38%) Microsoft PowerPoint
1 1 (0.38%) MS Visio
1 1 (0.38%) Notion
1 1 (0.38%) PlantUML
Business Applications
1 2 (0.75%) Payment Gateway
Cloud Services
1 228 (86.04%) AWS
2 213 (80.38%) Azure
3 113 (42.64%) GCP
4 10 (3.77%) GitHub
5 9 (3.40%) Amazon S3
5 9 (3.40%) AWS Lambda
5 9 (3.40%) Serverless
6 6 (2.26%) CloudFront
6 6 (2.26%) Figma
7 5 (1.89%) Amazon EKS
7 5 (1.89%) AWS CloudFormation
8 4 (1.51%) Amazon ECS
8 4 (1.51%) Amazon SQS
8 4 (1.51%) Azure Data Factory
8 4 (1.51%) npm
9 3 (1.13%) Amazon EC2
9 3 (1.13%) Amazon ElastiCache
9 3 (1.13%) Datadog
9 3 (1.13%) Google Workspace
9 3 (1.13%) SaaS
Communications & Networking
1 3 (1.13%) SAN
2 1 (0.38%) Ethernet
2 1 (0.38%) Firewall
2 1 (0.38%) Multicast
2 1 (0.38%) Network Security
2 1 (0.38%) SSH
Database & Business Intelligence
1 211 (79.62%) SQL Server
2 16 (6.04%) PostgreSQL
3 8 (3.02%) Elasticsearch
3 8 (3.02%) MongoDB
4 7 (2.64%) SQL Server Integration Services
5 6 (2.26%) MySQL
5 6 (2.26%) Relational Database
6 5 (1.89%) Amazon RDS
6 5 (1.89%) RDBMS
7 3 (1.13%) Amazon Aurora
7 3 (1.13%) DB2
8 2 (0.75%) Data Warehouse
8 2 (0.75%) NoSQL
8 2 (0.75%) Oracle Database
8 2 (0.75%) Power BI
8 2 (0.75%) Redis
8 2 (0.75%) SQL Server Analysis Services
8 2 (0.75%) SQL Server Reporting Services
9 1 (0.38%) Big Data
9 1 (0.38%) Metadata
Development Applications
1 233 (87.92%) JIRA
2 214 (80.75%) GitLab
3 211 (79.62%) SonarQube
4 206 (77.74%) Selenium
5 205 (77.36%) Sonatype Nexus
6 203 (76.60%) Cucumber
7 202 (76.23%) Maven
8 27 (10.19%) Git
9 20 (7.55%) Jenkins
10 8 (3.02%) JUnit
10 8 (3.02%) Vite
11 7 (2.64%) Cypress.io
12 6 (2.26%) Octopus Deploy
13 5 (1.89%) Postman
13 5 (1.89%) TeamCity
14 4 (1.51%) Mockito
14 4 (1.51%) Visual Studio
15 3 (1.13%) Artifactory
15 3 (1.13%) REST Assured
15 3 (1.13%) Visual Studio Code
General
1 213 (80.38%) Finance
2 200 (75.47%) Banking
3 198 (74.72%) Inclusion and Diversity
4 91 (34.34%) Investment Banking
5 90 (33.96%) Corporate Banking
5 90 (33.96%) Retail
6 33 (12.45%) Social Skills
7 11 (4.15%) Analytical Skills
8 8 (3.02%) Public Sector
9 7 (2.64%) Advertising
10 4 (1.51%) Back Office
10 4 (1.51%) Manufacturing
11 2 (0.75%) Electronics
11 2 (0.75%) Marketing
12 1 (0.38%) Aerospace
12 1 (0.38%) Automotive
12 1 (0.38%) Front Office
12 1 (0.38%) Games
12 1 (0.38%) Law
12 1 (0.38%) Telecoms
Job Titles
1 203 (76.60%) Software Engineer
2 23 (8.68%) Developer
3 16 (6.04%) Senior
4 11 (4.15%) Lead
5 10 (3.77%) DevOps Engineer
6 7 (2.64%) Software Developer
7 6 (2.26%) Cloud Engineer
7 6 (2.26%) Senior DevOps
7 6 (2.26%) Senior DevOps Engineer
8 5 (1.89%) DBA
8 5 (1.89%) Senior Cloud Engineer
8 5 (1.89%) Senior Manager
8 5 (1.89%) Senior Technical Manager
8 5 (1.89%) SQL DBA
8 5 (1.89%) Technical Leader
8 5 (1.89%) Technical Manager
9 4 (1.51%) .NET Developer
9 4 (1.51%) Backend Developer
9 4 (1.51%) Full-Stack Developer
9 4 (1.51%) Java Developer
Libraries, Frameworks & Software Standards
1 212 (80.00%) React
2 209 (78.87%) CSS
2 209 (78.87%) HTML
2 209 (78.87%) Spring
2 209 (78.87%) Spring Boot
3 203 (76.60%) Kafka
4 199 (75.09%) JPA
4 199 (75.09%) Redux
5 112 (42.26%) Hibernate
6 104 (39.25%) REST
7 97 (36.60%) Jest
8 96 (36.23%) RESTful
9 95 (35.85%) Sass
10 93 (35.09%) HTML5
11 92 (34.72%) CSS3
12 9 (3.40%) Elastic Stack
13 8 (3.02%) .NET
14 6 (2.26%) SOAP
15 5 (1.89%) .NET Framework
15 5 (1.89%) Swagger
Miscellaneous
1 199 (75.09%) Product Ownership
2 198 (74.72%) Enterprise Software
3 6 (2.26%) Cloud Native
4 5 (1.89%) Virtual Team
5 4 (1.51%) Clustering
6 3 (1.13%) Life Science
7 2 (0.75%) Hedge funds
7 2 (0.75%) IoT
7 2 (0.75%) SWIFT Messaging Network
8 1 (0.38%) Animation
8 1 (0.38%) CAN bus
8 1 (0.38%) Cyber Defence
8 1 (0.38%) Embedded Systems
8 1 (0.38%) FMCG
8 1 (0.38%) FPGA
8 1 (0.38%) Greenfield Project
8 1 (0.38%) Legacy Code
8 1 (0.38%) Onboarding
8 1 (0.38%) Self-Motivation
Operating Systems
1 19 (7.17%) Linux
2 6 (2.26%) Windows
3 2 (0.75%) Unix
3 2 (0.75%) zOS
Processes & Methodologies
1 234 (88.30%) CI/CD
2 233 (87.92%) DevOps
3 222 (83.77%) Agile
4 214 (80.75%) Front End Development
5 212 (80.00%) Test Automation
6 208 (78.49%) Full-Stack Development
6 208 (78.49%) Software Engineering
7 207 (78.11%) Microservices
8 205 (77.36%) SDLC
9 204 (76.98%) Containerisation
10 201 (75.85%) Performance Optimisation
11 120 (45.28%) Continuous Improvement
12 110 (41.51%) TDD
13 108 (40.75%) Clean Code
14 104 (39.25%) Mentoring
15 101 (38.11%) User Experience
16 100 (37.74%) Strategic Thinking
17 93 (35.09%) Migration
18 90 (33.96%) Responsive Web Design
19 19 (7.17%) Problem-Solving
Programming Languages
1 228 (86.04%) Java
2 225 (84.91%) SQL
3 221 (83.40%) JavaScript
4 100 (37.74%) TypeScript
5 14 (5.28%) Python
6 13 (4.91%) C#
7 6 (2.26%) Apex Code
7 6 (2.26%) Bash
7 6 (2.26%) PowerShell
7 6 (2.26%) T-SQL
8 2 (0.75%) COBOL
8 2 (0.75%) Shell Script
9 1 (0.38%) C
9 1 (0.38%) C++
9 1 (0.38%) Go
9 1 (0.38%) Groovy
9 1 (0.38%) Kotlin
9 1 (0.38%) Perl
9 1 (0.38%) PHP
9 1 (0.38%) XQuery
Qualifications
1 15 (5.66%) Degree
2 11 (4.15%) Computer Science Degree
3 6 (2.26%) AWS Certification
3 6 (2.26%) AWS Certified Solutions Architect
4 5 (1.89%) AWS Certified Developer
4 5 (1.89%) DBS Check
5 2 (0.75%) DV Cleared
5 2 (0.75%) Security Cleared
6 1 (0.38%) HNC
6 1 (0.38%) HND
6 1 (0.38%) SC Cleared
Quality Assurance & Compliance
1 205 (77.36%) QA
2 104 (39.25%) Accessibility
3 3 (1.13%) WCAG
4 2 (0.75%) SEPA
5 1 (0.38%) SLA
System Software
1 220 (83.02%) Docker
2 3 (1.13%) VMware Infrastructure
2 3 (1.13%) vSphere
3 1 (0.38%) Embedded Firmware
3 1 (0.38%) Firmware
3 1 (0.38%) iptables
Systems Management
1 209 (78.87%) Kubernetes
2 15 (5.66%) Terraform
3 14 (5.28%) Ansible
4 7 (2.64%) Grafana
5 5 (1.89%) Kibana
6 4 (1.51%) Prometheus
7 3 (1.13%) Control-M
7 3 (1.13%) Docker Swarm
7 3 (1.13%) Kustomize
7 3 (1.13%) Packer
8 2 (0.75%) CA Endevor
8 2 (0.75%) logstash
9 1 (0.38%) Progress Chef
9 1 (0.38%) Puppet
9 1 (0.38%) ZABBIX
Vendors
1 199 (75.09%) Solace
2 8 (3.02%) Atlassian
3 7 (2.64%) Informatica
3 7 (2.64%) Oracle
4 6 (2.26%) Salesforce
5 5 (1.89%) RedGate
5 5 (1.89%) Talend
6 3 (1.13%) Dynatrace
6 3 (1.13%) Google
6 3 (1.13%) Microsoft
6 3 (1.13%) MuleSoft
6 3 (1.13%) Red Hat
6 3 (1.13%) Splunk
6 3 (1.13%) VMware
7 2 (0.75%) AppDynamics
7 2 (0.75%) CA Agile Central
7 2 (0.75%) IBM
8 1 (0.38%) Adobe
8 1 (0.38%) New Relic
8 1 (0.38%) PagerDuty