nginx
UK

The table below provides summary statistics for permanent job vacancies requiring nginx skills. It includes a benchmarking guide to the annual salaries offered in vacancies that cited nginx over the 6 months leading up to 26 April 2025, comparing them to the same period in the previous two years.

6 months to
26 Apr 2025
Same period 2024 Same period 2023
Rank 594 700 745
Rank change year-on-year +106 +45 -19
Permanent jobs citing nginx 93 197 250
As % of all permanent jobs advertised in the UK 0.18% 0.20% 0.24%
As % of the Application Platforms category 2.10% 1.84% 2.06%
Number of salaries quoted 68 146 168
10th Percentile £46,875 £35,000 £40,000
25th Percentile £56,250 £50,000 £51,250
Median annual salary (50th Percentile) £66,250 £60,000 £65,000
Median % change year-on-year +10.42% -7.69% -
75th Percentile £87,500 £80,000 £92,500
90th Percentile £89,125 £87,500 £95,000
UK excluding London median annual salary £65,000 £57,500 £60,000
% change year-on-year +13.04% -4.17% +9.09%

All Application Platform Skills
UK

nginx falls under the Application Platforms category. For comparison with the information above, the following table provides summary statistics for all permanent job vacancies requiring application platform skills.

Permanent vacancies with a requirement for application platform skills 4,426 10,734 12,156
As % of all permanent jobs advertised in the UK 8.58% 10.93% 11.56%
Number of salaries quoted 3,060 7,091 7,990
10th Percentile £30,000 £27,500 £31,250
25th Percentile £37,574 £34,000 £40,000
Median annual salary (50th Percentile) £55,000 £50,000 £55,000
Median % change year-on-year +10.00% -9.09% +1.85%
75th Percentile £75,000 £67,500 £77,500
90th Percentile £108,875 £91,250 £97,290
UK excluding London median annual salary £45,628 £42,500 £47,500
% change year-on-year +7.36% -10.53% +5.56%

nginx
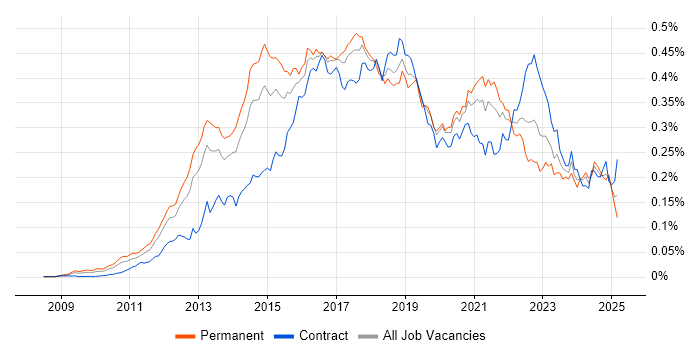
Job Vacancy Trend

Job postings citing nginx as a proportion of all IT jobs advertised.

Job vacancy trend for nginx in the UK

nginx
Salary Trend

3-month moving average salary quoted in jobs citing nginx.

Salary trend for nginx in the UK

nginx
Salary Histogram

Salary distribution for jobs citing nginx over the 6 months to 26 April 2025.

Salary histogram for nginx in the UK

nginx
Top 12 Job Locations

The table below looks at the demand and provides a guide to the median salaries quoted in IT jobs citing nginx within the UK over the 6 months to 26 April 2025. The 'Rank Change' column provides an indication of the change in demand within each location based on the same 6 month period last year.

Location Rank Change
on Same Period
Last Year
Matching
Permanent
IT Job Ads
Median Salary
Past 6 Months
Median Salary
% Change
on Same Period
Last Year
Live
Jobs
England +76 82 £75,000 +25.00% 85
UK excluding London +110 44 £65,000 +13.04% 56
London +108 42 £82,500 +10.00% 42
Work from Home +111 35 £71,250 +18.75% 54
North of England +82 15 £60,000 +16.50% 19
South West +105 12 £45,000 -41.94% 3
North West +39 11 £65,000 +8.33% 12
South East +45 6 £75,000 +25.00% 14
Northern Ireland +40 6 £55,000 +4.76% 1
East of England +59 5 £90,000 +125.00% 9
Yorkshire +69 3 £55,000 +64.12% 6
North East +52 1 - - 1

nginx
Co-occurring Skills and Capabilities by Category

The follow tables expand on the table above by listing co-occurrences grouped by category. The same employment type, locality and period is covered with up to 20 co-occurrences shown in each of the following categories:

Application Platforms
1 18 (19.35%) Apache
2 13 (13.98%) Apache Solr
3 11 (11.83%) Tomcat
4 8 (8.60%) Camunda
5 2 (2.15%) Confluence
6 1 (1.08%) Drupal
6 1 (1.08%) Microsoft Exchange
Applications
1 4 (4.30%) Microsoft Office
1 4 (4.30%) Photoshop
2 3 (3.23%) Microsoft Excel
3 1 (1.08%) Adobe Creative Suite
3 1 (1.08%) InDesign
Cloud Services
1 57 (61.29%) AWS
2 13 (13.98%) GCP
3 11 (11.83%) OpenShift
3 11 (11.83%) SaaS
4 8 (8.60%) Amazon ElastiCache
4 8 (8.60%) Amazon OpenSearch
4 8 (8.60%) Amazon SQS
4 8 (8.60%) GitHub
4 8 (8.60%) IBM Cloud
5 7 (7.53%) Amazon CloudWatch
5 7 (7.53%) Azure
6 6 (6.45%) AWS CloudTrail
7 3 (3.23%) Entra ID
7 3 (3.23%) MinIO
8 2 (2.15%) Amazon S3
8 2 (2.15%) AWS CloudFormation
8 2 (2.15%) Power Platform
9 1 (1.08%) Amazon EC2
9 1 (1.08%) Datadog
9 1 (1.08%) Microsoft 365
Communications & Networking
1 19 (20.43%) DNS
2 12 (12.90%) HTTPS
2 12 (12.90%) IPsec
2 12 (12.90%) TCP/IP
3 10 (10.75%) Firewall
4 4 (4.30%) Cisco Nexus
5 3 (3.23%) Multicast
5 3 (3.23%) VLAN
6 2 (2.15%) Reverse Proxy
6 2 (2.15%) Value-Added Service
7 1 (1.08%) NAS
7 1 (1.08%) Network Security
7 1 (1.08%) SAN
7 1 (1.08%) SNMP
7 1 (1.08%) SSH
7 1 (1.08%) SSL
7 1 (1.08%) Wireshark
Database & Business Intelligence
1 22 (23.66%) MySQL
2 15 (16.13%) PostgreSQL
3 14 (15.05%) Amazon RDS
4 13 (13.98%) NoSQL
5 12 (12.90%) Couchbase
6 10 (10.75%) Elasticsearch
7 9 (9.68%) MongoDB
8 8 (8.60%) Amazon Aurora
8 8 (8.60%) MariaDB
8 8 (8.60%) Oracle Database
9 5 (5.38%) Redis
10 2 (2.15%) Power BI
11 1 (1.08%) Big Data
11 1 (1.08%) BigQuery
11 1 (1.08%) Metadata
Development Applications
1 14 (15.05%) Git
1 14 (15.05%) Jenkins
2 10 (10.75%) Bitbucket
3 9 (9.68%) Maven
4 8 (8.60%) Cucumber
4 8 (8.60%) JIRA
4 8 (8.60%) JUnit
4 8 (8.60%) Mockito
4 8 (8.60%) Postman
4 8 (8.60%) Selenium
4 8 (8.60%) SonarQube
4 8 (8.60%) TestNG
5 4 (4.30%) GitLab
5 4 (4.30%) Sonatype Nexus
6 1 (1.08%) Babel
6 1 (1.08%) Gradle
6 1 (1.08%) gulp
6 1 (1.08%) PHPUnit
6 1 (1.08%) webpack
General
1 36 (38.71%) Social Skills
2 28 (30.11%) Finance
3 21 (22.58%) Analytical Skills
4 16 (17.20%) Public Sector
5 10 (10.75%) Manufacturing
6 9 (9.68%) Inclusion and Diversity
7 3 (3.23%) Back Office
7 3 (3.23%) Banking
7 3 (3.23%) Publishing
8 2 (2.15%) Aerospace
8 2 (2.15%) Automotive
8 2 (2.15%) Games
8 2 (2.15%) iGaming
8 2 (2.15%) Legal
9 1 (1.08%) Documentation Skills
9 1 (1.08%) Fire and Rescue
9 1 (1.08%) Retail
Job Titles
1 22 (23.66%) Developer
2 19 (20.43%) Senior
3 13 (13.98%) Front-End Developer (Client-Side Developer)
4 12 (12.90%) DevOps Engineer
5 11 (11.83%) Administrator
5 11 (11.83%) Systems Administrator
6 10 (10.75%) Linux Engineer
7 9 (9.68%) Senior DevOps
7 9 (9.68%) Senior DevOps Engineer
7 9 (9.68%) Systems Engineer
8 8 (8.60%) AWS Engineer
8 8 (8.60%) Full-Stack Engineer
8 8 (8.60%) Java Engineer
8 8 (8.60%) Linux Systems Engineer
9 7 (7.53%) GCP DevOps
9 7 (7.53%) Lead
9 7 (7.53%) Lead DevOps
9 7 (7.53%) Python Developer
10 6 (6.45%) Angular Developer
10 6 (6.45%) HTML CSS Developer
Libraries, Frameworks & Software Standards
1 23 (24.73%) React
2 17 (18.28%) CSS
2 17 (18.28%) HTML
3 16 (17.20%) Swagger
4 15 (16.13%) Node.js
5 14 (15.05%) AngularJS
5 14 (15.05%) REST
6 13 (13.98%) RabbitMQ
7 10 (10.75%) RESTful
8 9 (9.68%) Kafka
9 8 (8.60%) Elastic Stack
9 8 (8.60%) Gherkin
9 8 (8.60%) Guice
9 8 (8.60%) JAX-RS
9 8 (8.60%) KeystoneJS
9 8 (8.60%) LEMP Stack
9 8 (8.60%) Mustache
9 8 (8.60%) Spring
9 8 (8.60%) Spring Boot
9 8 (8.60%) WireMock
Miscellaneous
1 10 (10.75%) Analytical Mindset
1 10 (10.75%) Hybrid Cloud
1 10 (10.75%) Life Science
2 9 (9.68%) Data Centre
3 8 (8.60%) Blockchain
3 8 (8.60%) e-Learning
4 6 (6.45%) CMDB
5 3 (3.23%) Cloud Native
6 2 (2.15%) Distributed Systems
6 2 (2.15%) EPoS
6 2 (2.15%) Mobile App
6 2 (2.15%) Mobile Games
6 2 (2.15%) Product Ownership
6 2 (2.15%) Public Cloud
6 2 (2.15%) Sports Betting
7 1 (1.08%) Client/Server
7 1 (1.08%) Legacy Applications
7 1 (1.08%) Linux Command Line
7 1 (1.08%) Management Information System
7 1 (1.08%) Onboarding
Operating Systems
1 40 (43.01%) Linux
2 22 (23.66%) Windows
3 11 (11.83%) Ubuntu
4 10 (10.75%) Debian
5 8 (8.60%) Red Hat Enterprise Linux
6 6 (6.45%) Windows Server
7 4 (4.30%) CentOS
8 3 (3.23%) Rocky
9 2 (2.15%) Android
9 2 (2.15%) Apple iOS
10 1 (1.08%) Amazon Linux
10 1 (1.08%) Mac OS
10 1 (1.08%) Unix
Processes & Methodologies
1 39 (41.94%) DevOps
2 36 (38.71%) CI/CD
3 31 (33.33%) Problem-Solving
4 20 (21.51%) Asset Management
5 19 (20.43%) Continuous Improvement
6 18 (19.35%) E-Commerce
7 15 (16.13%) Agile
8 14 (15.05%) Full-Stack Development
9 13 (13.98%) Front End Development
9 13 (13.98%) Infrastructure Engineering
10 12 (12.90%) Code Quality
10 12 (12.90%) Collaborative Working
10 12 (12.90%) Software Delivery
11 11 (11.83%) Data Science
11 11 (11.83%) Web Development
12 10 (10.75%) Configuration Management
12 10 (10.75%) Data Visualisation
12 10 (10.75%) Responsive Web Design
12 10 (10.75%) Usability Testing
12 10 (10.75%) Visualisation
Programming Languages
1 33 (35.48%) JavaScript
2 23 (24.73%) Python
3 21 (22.58%) Java
4 17 (18.28%) PHP
5 12 (12.90%) Bash
6 8 (8.60%) Lua
7 6 (6.45%) SQL
8 3 (3.23%) Shell Script
9 2 (2.15%) Go
9 2 (2.15%) TypeScript
10 1 (1.08%) C
10 1 (1.08%) Perl
10 1 (1.08%) PowerShell
10 1 (1.08%) R
10 1 (1.08%) Rust
Qualifications
1 14 (15.05%) Security Cleared
2 4 (4.30%) Degree
2 4 (4.30%) ITIL Certification
2 4 (4.30%) SC Cleared
3 2 (2.15%) AWS Certification
3 2 (2.15%) AWS Certified Solutions Architect
3 2 (2.15%) BPSS Clearance
3 2 (2.15%) DBS Check
3 2 (2.15%) DV Cleared
4 1 (1.08%) Computer Science Degree
Quality Assurance & Compliance
1 10 (10.75%) Accessibility
2 6 (6.45%) QA
3 1 (1.08%) ISO/IEC 27001
3 1 (1.08%) PMO
System Software
1 38 (40.86%) Docker
2 13 (13.98%) VMware Infrastructure
3 9 (9.68%) VMware ESXi
4 8 (8.60%) Active Directory
5 4 (4.30%) Virtual Desktop
6 3 (3.23%) Samba
6 3 (3.23%) Squid
7 1 (1.08%) Hyper-V
Systems Management
1 31 (33.33%) Ansible
2 29 (31.18%) Kubernetes
3 24 (25.81%) Terraform
4 8 (8.60%) HAProxy
4 8 (8.60%) Kustomize
4 8 (8.60%) Nagios
4 8 (8.60%) Packer
5 5 (5.38%) Graylog
5 5 (5.38%) Puppet
6 4 (4.30%) Rundeck
7 3 (3.23%) Grafana
7 3 (3.23%) Istio
7 3 (3.23%) Microsoft Intune
7 3 (3.23%) Red Hat Satellite
8 2 (2.15%) Prometheus
9 1 (1.08%) linkerd
9 1 (1.08%) Proxmox
Vendors
1 24 (25.81%) Red Hat
2 13 (13.98%) VMware
3 10 (10.75%) IBM
4 9 (9.68%) Microsoft
5 8 (8.60%) Oracle
6 6 (6.45%) ServiceNow
7 5 (5.38%) Google
8 4 (4.30%) Cisco
8 4 (4.30%) Citrix
8 4 (4.30%) Juniper
8 4 (4.30%) NetApp
8 4 (4.30%) PagerDuty
8 4 (4.30%) Pure Storage
8 4 (4.30%) Veeam
9 3 (3.23%) HP
9 3 (3.23%) SolarWinds
10 2 (2.15%) Hitachi
10 2 (2.15%) McAfee
10 2 (2.15%) Sophos
10 2 (2.15%) Splunk