Computer Science Jobs in the South East

Computer Science
England > South East

The table below provides summary statistics for permanent job vacancies advertised in the South East requiring Computer Science skills. It includes a benchmarking guide to the annual salaries offered in vacancies that cited Computer Science over the 6 months leading up to 30 May 2025, comparing them to the same period in the previous two years.

6 months to
30 May 2025
Same period 2024 Same period 2023
Rank 16 31 41
Rank change year-on-year +15 +10 -10
Permanent jobs citing Computer Science 881 1,054 882
As % of all permanent jobs advertised in the South East 9.14% 6.01% 6.28%
As % of the Processes & Methodologies category 9.93% 7.20% 6.65%
Number of salaries quoted 478 769 454
10th Percentile £31,750 £32,500 £32,500
25th Percentile £42,500 £41,250 £40,000
Median annual salary (50th Percentile) £60,000 £60,000 £58,943
Median % change year-on-year - +1.79% +17.89%
75th Percentile £68,000 £75,000 £75,000
90th Percentile £75,000 £87,500 £95,000
England median annual salary £60,000 £60,000 £65,000
% change year-on-year - -7.69% +8.33%

All Process and Methodology Skills
South East

Computer Science falls under the Processes and Methodologies category. For comparison with the information above, the following table provides summary statistics for all permanent job vacancies requiring process or methodology skills in the South East.

Permanent vacancies with a requirement for process or methodology skills 8,872 14,647 13,269
As % of all permanent jobs advertised in the South East 92.08% 83.51% 94.48%
Number of salaries quoted 4,278 10,075 7,715
10th Percentile £29,175 £27,750 £30,500
25th Percentile £39,750 £36,875 £41,250
Median annual salary (50th Percentile) £55,000 £50,000 £55,000
Median % change year-on-year +10.00% -9.09% -
75th Percentile £70,000 £65,000 £72,500
90th Percentile £78,750 £77,500 £85,000
England median annual salary £57,500 £55,000 £62,500
% change year-on-year +4.55% -12.00% +4.17%

Computer Science
Job Vacancy Trend in the South East

Job postings citing Computer Science as a proportion of all IT jobs advertised in the South East.
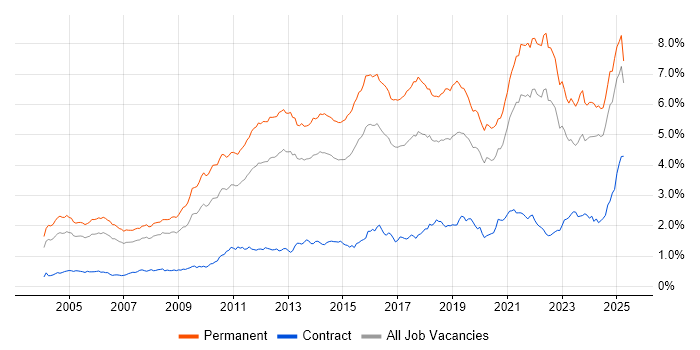
Job vacancy trend for Computer Science in the South East

Computer Science
Salary Trend in the South East

3-month moving average salary quoted in jobs citing Computer Science in the South East.

Salary trend for Computer Science in the South East

Computer Science
Salary Histogram in the South East

Salary distribution for jobs citing Computer Science in the South East over the 6 months to 30 May 2025.

Salary histogram for Computer Science in the South East

Computer Science
Job Locations in the South East

The table below looks at the demand and provides a guide to the median salaries quoted in IT jobs citing Computer Science within the South East region over the 6 months to 30 May 2025. The 'Rank Change' column provides an indication of the change in demand within each location based on the same 6 month period last year.

Location Rank Change
on Same Period
Last Year
Matching
Permanent
IT Job Ads
Median Salary
Past 6 Months
Median Salary
% Change
on Same Period
Last Year
Live
Jobs
Isle of Wight - 257 £65,000 - 17
Thames Valley -11 242 £55,000 -8.33% 1,003
Berkshire +2 184 £55,283 -21.03% 672
Surrey +26 126 £45,000 -24.05% 231
Hampshire +13 91 £55,000 +10.00% 328
West Sussex +12 60 £70,000 +9.38% 110
Middlesex +14 42 £60,000 -4.00% 3
East Sussex +7 37 £33,500 -33.00% 115
Buckinghamshire -44 32 £45,000 +5.88% 205
Oxfordshire -20 26 £60,000 +14.29% 129
Kent +8 24 £40,101 -38.31% 201
Computer Science
England

Computer Science
Co-occurring Skills and Capabilities in the South East by Category

The follow tables expand on the table above by listing co-occurrences grouped by category. The same employment type, locality and period is covered with up to 20 co-occurrences shown in each of the following categories:

Application Platforms
1 32 (3.63%) SharePoint
2 18 (2.04%) Microsoft Exchange
3 15 (1.70%) Apache Spark
4 3 (0.34%) CMS
4 3 (0.34%) IIS
4 3 (0.34%) Umbraco
5 2 (0.23%) Apache
5 2 (0.23%) ThingWorx
6 1 (0.11%) Confluence
Applications
1 35 (3.97%) Simulink
2 6 (0.68%) Chatbot
3 3 (0.34%) Microsoft PowerPoint
4 2 (0.23%) Microsoft Office
5 1 (0.11%) Microsoft Excel
Business Applications
1 35 (3.97%) Teamcenter
2 4 (0.45%) SAP Business One
3 2 (0.23%) Sage 200
3 2 (0.23%) SAP S/4HANA
4 1 (0.11%) Oracle EBS
4 1 (0.11%) SAP ERP
4 1 (0.11%) SAP EWM
4 1 (0.11%) SAP GRC
4 1 (0.11%) SAP MM
4 1 (0.11%) SAP WM
Cloud Services
1 115 (13.05%) Azure
2 59 (6.70%) AWS
3 35 (3.97%) Azure DevOps
3 35 (3.97%) Power Platform
4 34 (3.86%) GCP
5 27 (3.06%) Power Automate
6 26 (2.95%) PowerApps
7 25 (2.84%) PaaS
8 21 (2.38%) Salesforce Sales Cloud
9 13 (1.48%) Microsoft 365
10 12 (1.36%) SaaS
11 11 (1.25%) Azure Monitor
12 7 (0.79%) GitHub
13 6 (0.68%) Cloud Computing
14 5 (0.57%) Collibra
14 5 (0.57%) IaaS
14 5 (0.57%) Microsoft Purview
15 4 (0.45%) Azure Data Factory
15 4 (0.45%) Google Workspace
15 4 (0.45%) Serverless
Communications & Networking
1 94 (10.67%) Broadband
2 17 (1.93%) NAS
2 17 (1.93%) SAN
3 15 (1.70%) Network Security
4 14 (1.59%) Firewall
5 12 (1.36%) TCP/IP
6 5 (0.57%) IP Telephony
6 5 (0.57%) SNMP
7 4 (0.45%) HTTP
7 4 (0.45%) HTTPS
7 4 (0.45%) Internet
8 3 (0.34%) DHCP
8 3 (0.34%) DNS
8 3 (0.34%) VoIP
8 3 (0.34%) VPN
8 3 (0.34%) Wireless
9 2 (0.23%) Cisco IOS
9 2 (0.23%) InfiniBand
9 2 (0.23%) Wi-Fi
10 1 (0.11%) MQTT
Database & Business Intelligence
1 43 (4.88%) SQL Server
2 39 (4.43%) Big Data
3 36 (4.09%) Data Lake
4 35 (3.97%) Power BI
5 27 (3.06%) Tableau
6 16 (1.82%) NoSQL
6 16 (1.82%) Relational Database
7 12 (1.36%) Hadoop
8 11 (1.25%) Data Warehouse
9 4 (0.45%) Azure SQL Database
9 4 (0.45%) MongoDB
9 4 (0.45%) PostgreSQL
9 4 (0.45%) SQL Server Integration Services
9 4 (0.45%) SQL Server Reporting Services
10 3 (0.34%) Metadata
10 3 (0.34%) MySQL
10 3 (0.34%) Pinecone
10 3 (0.34%) Weaviate
11 2 (0.23%) RDBMS
12 1 (0.11%) PowerCenter
Development Applications
1 41 (4.65%) Git
2 35 (3.97%) Rational DOORS
3 18 (2.04%) JIRA
4 12 (1.36%) Visual Studio
5 11 (1.25%) Jenkins
6 4 (0.45%) Vite
7 3 (0.34%) Bitbucket
7 3 (0.34%) Cypress.io
7 3 (0.34%) MLflow
7 3 (0.34%) Octopus Deploy
7 3 (0.34%) Visual Studio Code
8 2 (0.23%) Gatling
8 2 (0.23%) JUnit
8 2 (0.23%) Moq
8 2 (0.23%) Selenium
8 2 (0.23%) SpecFlow
9 1 (0.11%) CMake
9 1 (0.11%) ESLint
9 1 (0.11%) GitLab
9 1 (0.11%) Postman
General
1 337 (38.25%) Social Skills
2 124 (14.07%) Law
3 52 (5.90%) Finance
4 48 (5.45%) Electronics
5 45 (5.11%) Analytical Skills
6 43 (4.88%) Aerospace
7 30 (3.41%) Legal
8 25 (2.84%) Marketing
9 22 (2.50%) Retail
10 21 (2.38%) Organisational Skills
11 18 (2.04%) Influencing Skills
12 16 (1.82%) Manufacturing
13 15 (1.70%) Games
14 14 (1.59%) Multimedia
15 10 (1.14%) Telecoms
16 9 (1.02%) Inclusion and Diversity
17 8 (0.91%) Aviation
18 7 (0.79%) Advertising
19 5 (0.57%) Automotive
20 4 (0.45%) Back Office
Job Titles
1 179 (20.32%) Software Engineer
2 178 (20.20%) Senior
3 153 (17.37%) Lead
4 87 (9.88%) Principal Engineer
5 84 (9.53%) Architect
6 80 (9.08%) Principal Software Engineer
7 65 (7.38%) Systems Engineer
8 63 (7.15%) Senior Software Engineer
9 56 (6.36%) Software Architect
10 52 (5.90%) Developer
11 48 (5.45%) Junior
12 44 (4.99%) Engineering Manager
13 43 (4.88%) Test Engineer
14 42 (4.77%) Senior Software Test Engineer
14 42 (4.77%) Senior Test Engineer
14 42 (4.77%) Software Test Engineer
15 35 (3.97%) Junior Systems Engineer
16 23 (2.61%) Enterprise Architect
17 22 (2.50%) Team Leader
18 21 (2.38%) Security Engineer
Libraries, Frameworks & Software Standards
1 77 (8.74%) Middleware
2 38 (4.31%) HTML
3 37 (4.20%) .NET
4 26 (2.95%) REST
5 21 (2.38%) Lightning Web Components
5 21 (2.38%) React
5 21 (2.38%) SOAP
6 20 (2.27%) CSS
7 19 (2.16%) Node.js
8 18 (2.04%) Kafka
9 15 (1.70%) YAML
10 14 (1.59%) PyTorch
10 14 (1.59%) TensorFlow
11 11 (1.25%) Hugging Face
11 11 (1.25%) LangChain
12 9 (1.02%) .NET Framework
12 9 (1.02%) AngularJS
12 9 (1.02%) ASP.NET
12 9 (1.02%) jQuery
13 7 (0.79%) ASP.NET MVC
Miscellaneous
1 51 (5.79%) Management Information System
2 46 (5.22%) Enterprise Software
3 34 (3.86%) Algorithms
4 30 (3.41%) Social Media
5 20 (2.27%) Cloud Native
5 20 (2.27%) Security Posture
6 18 (2.04%) Acoustics
6 18 (2.04%) Product Ownership
7 16 (1.82%) Self-Motivation
8 14 (1.59%) Digital Media
9 13 (1.48%) Operational Technology
9 13 (1.48%) Public Cloud
10 12 (1.36%) Mobile App
11 11 (1.25%) Clustering
12 10 (1.14%) Data Centre
12 10 (1.14%) Video\Live Streaming
13 9 (1.02%) Life Science
13 9 (1.02%) SCADA
14 8 (0.91%) Driving Licence
15 7 (0.79%) Robotics
Operating Systems
1 71 (8.06%) Windows
2 42 (4.77%) Linux
3 29 (3.29%) Windows Vista
4 13 (1.48%) Android
4 13 (1.48%) Unix
5 11 (1.25%) Apple iOS
6 5 (0.57%) Windows Server
7 4 (0.45%) Mac OS
8 2 (0.23%) Red Hat Enterprise Linux
9 1 (0.11%) Debian
9 1 (0.11%) Ubuntu
Processes & Methodologies
1 323 (36.66%) Agile
2 243 (27.58%) UML
3 239 (27.13%) Software Engineering
4 217 (24.63%) Mentoring
5 208 (23.61%) Waterfall
6 201 (22.81%) Problem-Solving
7 176 (19.98%) Configuration Management
8 150 (17.03%) Continuous Improvement
9 142 (16.12%) Roadmaps
10 138 (15.66%) DevOps
11 134 (15.21%) High Availability
12 126 (14.30%) Product Management
12 126 (14.30%) Project Management
13 116 (13.17%) SDLC
14 97 (11.01%) Software Testing
14 97 (11.01%) Test Automation
15 93 (10.56%) Stakeholder Management
16 91 (10.33%) Open Source
17 88 (9.99%) Mathematics
18 87 (9.88%) Design Patterns
Programming Languages
1 96 (10.90%) Python
2 92 (10.44%) Ada
3 78 (8.85%) C#
4 75 (8.51%) SQL
5 71 (8.06%) Java
6 62 (7.04%) C++
7 58 (6.58%) MATLAB
8 56 (6.36%) JavaScript
9 39 (4.43%) C
10 38 (4.31%) PowerShell
10 38 (4.31%) TypeScript
11 36 (4.09%) Ada 95
12 27 (3.06%) PHP
12 27 (3.06%) Rust
13 22 (2.50%) Apex Code
14 19 (2.16%) R
15 16 (1.82%) Dart
15 16 (1.82%) Ruby
16 14 (1.59%) Kotlin
17 13 (1.48%) Bash
Qualifications
1 794 (90.12%) Degree
2 378 (42.91%) Computer Science Degree
3 234 (26.56%) BPSS Clearance
4 148 (16.80%) Chartered Engineer
5 100 (11.35%) Master's Degree
6 42 (4.77%) Security Cleared
7 41 (4.65%) DBS Check
8 31 (3.52%) SC Cleared
9 21 (2.38%) PhD
10 17 (1.93%) DV Cleared
10 17 (1.93%) Microsoft Certification
11 16 (1.82%) Azure Certification
12 12 (1.36%) HND
13 11 (1.25%) AWS Certification
14 10 (1.14%) Numerate Degree
15 9 (1.02%) CISSP
16 8 (0.91%) PMI Certification
16 8 (0.91%) PMP
17 6 (0.68%) CISM
17 6 (0.68%) MCSE
Quality Assurance & Compliance
1 164 (18.62%) ISO/IEC 12207
2 53 (6.02%) Data Quality
3 30 (3.41%) ISO/IEC 27001
4 22 (2.50%) GDPR
5 19 (2.16%) NIST
6 15 (1.70%) NCSC
7 14 (1.59%) QA
8 13 (1.48%) Accessibility
9 9 (1.02%) California Consumer Privacy Act
10 7 (0.79%) Cyber Essentials
10 7 (0.79%) SLA
11 6 (0.68%) Cyber Essentials PLUS
12 5 (0.57%) HIPAA
13 3 (0.34%) GRC
13 3 (0.34%) SOC 2
14 2 (0.23%) COBIT
14 2 (0.23%) Def Stans
14 2 (0.23%) PCI DSS
14 2 (0.23%) WCAG
15 1 (0.11%) CDISC
System Software
1 23 (2.61%) Active Directory
2 21 (2.38%) Docker
3 18 (2.04%) VMware Infrastructure
4 6 (0.68%) Virtual Machines
5 3 (0.34%) HDFS
6 2 (0.23%) GPFS
6 2 (0.23%) Lustre
6 2 (0.23%) NFS
7 1 (0.11%) VMware NSX
Systems Management
1 35 (3.97%) Kubernetes
2 14 (1.59%) Grafana
2 14 (1.59%) Prometheus
3 11 (1.25%) Terraform
4 10 (1.14%) Ansible
5 6 (0.68%) ArcSight ESM
5 6 (0.68%) QRadar
6 3 (0.34%) Kubeflow
6 3 (0.34%) Puppet
7 2 (0.23%) FortiGate
8 1 (0.11%) Argo
8 1 (0.11%) Single Sign-On
Vendors
1 92 (10.44%) Microsoft
2 35 (3.97%) IBM
2 35 (3.97%) ServiceNow
3 22 (2.50%) Salesforce
4 21 (2.38%) Salesforce Marketing Cloud
5 18 (2.04%) VMware
6 12 (1.36%) OpenAI
7 11 (1.25%) Google
7 11 (1.25%) McAfee
8 8 (0.91%) SAP
9 6 (0.68%) ArcSight
9 6 (0.68%) Informatica
9 6 (0.68%) LogLogic
9 6 (0.68%) PayPal
9 6 (0.68%) Rockwell
9 6 (0.68%) Siemens
9 6 (0.68%) Splunk
10 5 (0.57%) Veeam
11 2 (0.23%) Dell
11 2 (0.23%) Sage