Replication Jobs in the UK excluding London

Replication
UK > UK excluding London

The table below looks at the prevalence of the term Replication in permanent job vacancies in the UK excluding London. Included is a benchmarking guide to the salaries offered in vacancies that cited Replication over the 6 months leading up to 15 May 2025, comparing them to the same period in the previous two years.

6 months to
15 May 2025
Same period 2024 Same period 2023
Rank 513 493 540
Rank change year-on-year -20 +47 -9
Permanent jobs citing Replication 72 281 213
As % of all permanent jobs advertised in the UK excluding London 0.18% 0.40% 0.36%
As % of the Miscellaneous category 0.55% 1.17% 0.85%
Number of salaries quoted 46 203 141
10th Percentile £31,250 £26,750 £31,250
25th Percentile £37,500 £32,500 £40,000
Median annual salary (50th Percentile) £46,000 £42,500 £50,000
Median % change year-on-year +8.24% -15.00% +5.26%
75th Percentile £57,500 £53,000 £60,250
90th Percentile £65,000 £60,000 £62,500
UK median annual salary £55,000 £50,000 £52,500
% change year-on-year +10.00% -4.76% -

All Generic Skills
UK excluding London

Replication falls under the General and Transferable Skills category. For comparison with the information above, the following table provides summary statistics for all permanent job vacancies requiring generic IT skills in the UK excluding London.

Permanent vacancies with a requirement for generic IT skills 13,048 24,060 25,206
As % of all permanent jobs advertised in the UK excluding London 33.38% 33.95% 42.27%
Number of salaries quoted 6,055 15,188 11,223
10th Percentile £29,000 £26,250 £31,250
25th Percentile £37,500 £35,000 £40,070
Median annual salary (50th Percentile) £55,000 £50,000 £55,000
Median % change year-on-year +10.00% -9.09% +4.76%
75th Percentile £68,000 £65,000 £70,000
90th Percentile £78,750 £80,000 £85,000
UK median annual salary £60,000 £55,000 £65,000
% change year-on-year +9.09% -15.38% +4.00%

Replication
Job Vacancy Trend in the UK excluding London

Job postings citing Replication as a proportion of all IT jobs advertised in the UK excluding London.
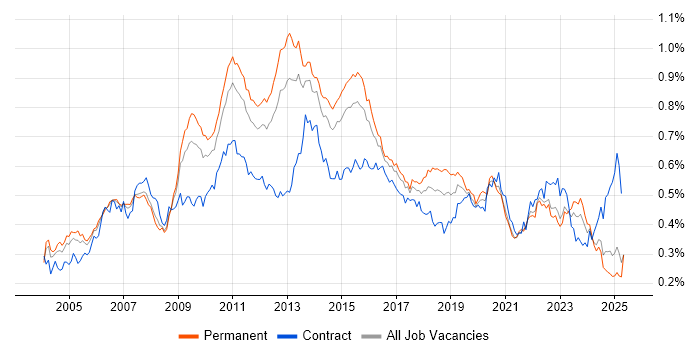
Job vacancy trend for Replication in the UK excluding London

Replication
Salary Trend in the UK excluding London

3-month moving average salary quoted in jobs citing Replication in the UK excluding London.

Salary trend for Replication in the UK excluding London

Replication
Salary Histogram in the UK excluding London

Salary distribution for jobs citing Replication in the UK excluding London over the 6 months to 15 May 2025.

Salary histogram for Replication in the UK excluding London

Replication
Job Locations in the UK excluding London

The table below looks at the demand and provides a guide to the median salaries quoted in IT jobs citing Replication within the UK excluding London region over the 6 months to 15 May 2025. The 'Rank Change' column provides an indication of the change in demand within each location based on the same 6 month period last year.

Location Rank Change
on Same Period
Last Year
Matching
Permanent
IT Job Ads
Median Salary
Past 6 Months
Median Salary
% Change
on Same Period
Last Year
Live
Jobs
North of England +41 21 £32,500 -17.72% 35
Midlands +36 18 £56,822 +53.57% 29
South East +53 17 £48,250 +14.88% 57
West Midlands +31 13 £56,800 +62.29% 17
Yorkshire +63 12 £32,500 -7.14% 15
North West -10 9 £45,000 -2.70% 17
Scotland +86 7 £40,000 -20.00% 14
South West +83 6 £30,000 -41.18% 23
East Midlands +33 5 £65,000 +44.44% 10
East of England +1 3 £42,500 +88.89% 28
Isle of Man +12 1 £34,500 -19.77% 2
Replication
UK

Replication
Co-occurring Skills and Capabilities in the UK excluding London by Category

The follow tables expand on the table above by listing co-occurrences grouped by category. The same employment type, locality and period is covered with up to 20 co-occurrences shown in each of the following categories:

Application Platforms
1 9 (12.50%) Microsoft Exchange
2 7 (9.72%) Confluence
2 7 (9.72%) SharePoint
3 6 (8.33%) Exchange Server 2013
4 3 (4.17%) IIS
5 2 (2.78%) Apache
5 2 (2.78%) Office Communications Server
5 2 (2.78%) SharePoint Server
5 2 (2.78%) Skype for Business
5 2 (2.78%) Tomcat
5 2 (2.78%) WebSphere
5 2 (2.78%) WebSphere Application Server
6 1 (1.39%) Exchange Server 2007
6 1 (1.39%) Exchange Server 2010
6 1 (1.39%) SharePoint 2010
Applications
1 3 (4.17%) Microsoft Office
Business Applications
1 2 (2.78%) SAP Oil and Gas
2 1 (1.39%) SAP MDG
2 1 (1.39%) SAP S/4HANA
Cloud Services
1 38 (52.78%) Azure
2 16 (22.22%) AWS
3 14 (19.44%) Microsoft 365
4 7 (9.72%) Entra ID
4 7 (9.72%) Power Platform
5 5 (6.94%) Amazon S3
5 5 (6.94%) Azure Data Factory
6 4 (5.56%) Amazon CloudWatch
6 4 (5.56%) Amazon EC2
6 4 (5.56%) Amazon ELB
6 4 (5.56%) Amazon Glacier
6 4 (5.56%) AWS KMS
6 4 (5.56%) GCP
6 4 (5.56%) OneDrive
6 4 (5.56%) Virtual Private Cloud
7 2 (2.78%) GitHub
8 1 (1.39%) Cloud Computing
8 1 (1.39%) Google Workspace
8 1 (1.39%) SaaS
8 1 (1.39%) Snowflake
Communications & Networking
1 23 (31.94%) SAN
2 19 (26.39%) Firewall
3 17 (23.61%) DNS
4 12 (16.67%) DHCP
4 12 (16.67%) VPN
5 9 (12.50%) NAS
6 8 (11.11%) Multicast
6 8 (11.11%) VLAN
7 7 (9.72%) WAN
8 6 (8.33%) iSCSI
8 6 (8.33%) LAN
8 6 (8.33%) SSL
8 6 (8.33%) TCP/IP
9 5 (6.94%) Wi-Fi
10 4 (5.56%) FTP
10 4 (5.56%) HTTP
10 4 (5.56%) IPsec
10 4 (5.56%) SSH
10 4 (5.56%) Wireless
11 3 (4.17%) Remote Desktop
Database & Business Intelligence
1 19 (26.39%) SQL Server
2 11 (15.28%) MongoDB
3 10 (13.89%) Big Data
4 7 (9.72%) Power BI
5 6 (8.33%) DB2
5 6 (8.33%) MySQL
6 5 (6.94%) Data Warehouse
6 5 (6.94%) SQL Server Integration Services
7 4 (5.56%) Amazon RDS
8 3 (4.17%) NoSQL
8 3 (4.17%) Oracle Reports
8 3 (4.17%) PostgreSQL
9 2 (2.78%) BusinessObjects
10 1 (1.39%) Oracle ODI
10 1 (1.39%) RDBMS
10 1 (1.39%) Relational Database
10 1 (1.39%) SAP HANA
10 1 (1.39%) Star Schema
10 1 (1.39%) Tableau
Development Applications
1 6 (8.33%) Jenkins
1 6 (8.33%) JIRA
1 6 (8.33%) Sonatype Nexus
2 5 (6.94%) Visual Studio
3 4 (5.56%) Git
3 4 (5.56%) Vagrant
4 1 (1.39%) LSMW
General
1 17 (23.61%) Social Skills
2 10 (13.89%) Banking
3 7 (9.72%) Analytical Skills
4 3 (4.17%) Manufacturing
5 2 (2.78%) Finance
5 2 (2.78%) Games
5 2 (2.78%) Law
5 2 (2.78%) Legal
5 2 (2.78%) Presentation Skills
6 1 (1.39%) Advertising
6 1 (1.39%) Organisational Skills
6 1 (1.39%) Public Sector
Job Titles
1 10 (13.89%) Software Engineer
2 9 (12.50%) Support Engineer
3 8 (11.11%) Support Technician
4 7 (9.72%) Senior
5 6 (8.33%) Analyst
5 6 (8.33%) Cloud Engineer
6 5 (6.94%) 3rd Line Engineer
6 5 (6.94%) 3rd Line Support
6 5 (6.94%) Data Engineer
6 5 (6.94%) IT Manager
6 5 (6.94%) IT Support
6 5 (6.94%) Training Manager
7 4 (5.56%) 3rd Line Support Technician
7 4 (5.56%) DevOps Engineer
7 4 (5.56%) IT Support Technician
7 4 (5.56%) IT Technician
7 4 (5.56%) Senior IT Support
7 4 (5.56%) Senior IT Technician
7 4 (5.56%) Senior Support Technician
7 4 (5.56%) Senior Technician
Libraries, Frameworks & Software Standards
1 10 (13.89%) gRPC
1 10 (13.89%) Kafka
2 3 (4.17%) Middleware
3 2 (2.78%) EDI
3 2 (2.78%) LAMP
3 2 (2.78%) LDAP
3 2 (2.78%) Loki
3 2 (2.78%) XML
4 1 (1.39%) ModSecurity
4 1 (1.39%) SAML
4 1 (1.39%) SAP Basis
4 1 (1.39%) SAP Fiori
4 1 (1.39%) SAP XI
Miscellaneous
1 10 (13.89%) Data Structures
1 10 (13.89%) Distributed Systems
1 10 (13.89%) Public Cloud
1 10 (13.89%) Reference Data
2 9 (12.50%) Clustering
3 7 (9.72%) Data Centre
4 5 (6.94%) Enterprise Storage
5 4 (5.56%) Management Information System
6 3 (4.17%) LPAR
7 2 (2.78%) Driving Licence
7 2 (2.78%) Life Science
7 2 (2.78%) Linux Command Line
7 2 (2.78%) Online Games
7 2 (2.78%) Renewable Energy
8 1 (1.39%) Legacy Systems
8 1 (1.39%) PKI
8 1 (1.39%) Team-Oriented Environment
8 1 (1.39%) Virtual Team
Operating Systems
1 40 (55.56%) Windows
2 21 (29.17%) Windows Server
3 19 (26.39%) Linux
4 18 (25.00%) Windows Server 2016
5 15 (20.83%) Windows Server 2019
6 7 (9.72%) Windows 10
7 6 (8.33%) Windows Server 2012
8 4 (5.56%) VMS
9 3 (4.17%) Amazon Linux
10 2 (2.78%) AIX
10 2 (2.78%) Android
10 2 (2.78%) Apple iOS
10 2 (2.78%) CentOS
10 2 (2.78%) Oracle Linux
10 2 (2.78%) Solaris
10 2 (2.78%) Unix
11 1 (1.39%) Mac OS
11 1 (1.39%) OS/400
11 1 (1.39%) Windows Server 2003
Processes & Methodologies
1 24 (33.33%) High Availability
2 16 (22.22%) Test Automation
3 15 (20.83%) Migration
3 15 (20.83%) Problem-Solving
4 14 (19.44%) Software Engineering
5 13 (18.06%) DevOps
6 10 (13.89%) Business Agility
6 10 (13.89%) Code Quality
6 10 (13.89%) Concurrent Programming
6 10 (13.89%) Microservices
6 10 (13.89%) Multithreading
6 10 (13.89%) SOA
6 10 (13.89%) Software Delivery
6 10 (13.89%) TDD
6 10 (13.89%) Unit Testing
7 9 (12.50%) Disaster Recovery
7 9 (12.50%) ITIL
8 8 (11.11%) Business Intelligence
9 7 (9.72%) Business Continuity
9 7 (9.72%) Performance Monitoring
Programming Languages
1 18 (25.00%) SQL
2 15 (20.83%) Java
3 14 (19.44%) PowerShell
4 11 (15.28%) Python
5 10 (13.89%) C#
6 5 (6.94%) Perl
7 4 (5.56%) Groovy
8 3 (4.17%) Bash
9 2 (2.78%) AWK
9 2 (2.78%) C
9 2 (2.78%) C++
9 2 (2.78%) Korn
9 2 (2.78%) PHP
10 1 (1.39%) RPG
Qualifications
1 13 (18.06%) Degree
2 9 (12.50%) Security Cleared
3 8 (11.11%) SC Cleared
4 6 (8.33%) Microsoft Certification
5 3 (4.17%) Azure Certification
5 3 (4.17%) Computer Science Degree
6 2 (2.78%) AWS Certification
6 2 (2.78%) DV Cleared
7 1 (1.39%) CCA
7 1 (1.39%) CCNA
7 1 (1.39%) Cisco Certification
7 1 (1.39%) Citrix Certification
7 1 (1.39%) DBS Check
7 1 (1.39%) HNC
7 1 (1.39%) HND
7 1 (1.39%) MCP
7 1 (1.39%) VMware Certified Professional (VCP)
Quality Assurance & Compliance
1 9 (12.50%) Cyber Essentials
2 6 (8.33%) ISO/IEC 27001
2 6 (8.33%) PCI DSS
3 4 (5.56%) Cyber Essentials PLUS
4 1 (1.39%) Data Quality
4 1 (1.39%) GDPR
4 1 (1.39%) NCSC
4 1 (1.39%) NIST
4 1 (1.39%) PMO
4 1 (1.39%) QA
4 1 (1.39%) SLA
4 1 (1.39%) SOC 2
System Software
1 28 (38.89%) Hyper-V
2 22 (30.56%) Active Directory
3 17 (23.61%) VMware Infrastructure
4 7 (9.72%) DFS Replication
5 5 (6.94%) Docker
6 4 (5.56%) KVM
6 4 (5.56%) VMware ESXi
7 3 (4.17%) NFS
7 3 (4.17%) PowerHA
8 2 (2.78%) ISA Server
8 2 (2.78%) Postfix
8 2 (2.78%) Sendmail
8 2 (2.78%) SRDF
8 2 (2.78%) Veritas Cluster Server
8 2 (2.78%) Virtual Machines
8 2 (2.78%) Xen
9 1 (1.39%) Firmware
9 1 (1.39%) Virtual Servers
9 1 (1.39%) XenApp
9 1 (1.39%) XenDesktop
Systems Management
1 15 (20.83%) Terraform
2 13 (18.06%) Kubernetes
3 7 (9.72%) Grafana
4 6 (8.33%) Ansible
4 6 (8.33%) Microsoft Intune
5 5 (6.94%) Prometheus
6 4 (5.56%) Dell DRAC
6 4 (5.56%) Failover Clustering
6 4 (5.56%) SCCM
7 3 (4.17%) Nagios
7 3 (4.17%) Nessus
7 3 (4.17%) Puppet
8 1 (1.39%) Backup Exec
8 1 (1.39%) cPanel
8 1 (1.39%) FortiGate
8 1 (1.39%) OpenVAS
8 1 (1.39%) Progress Chef
8 1 (1.39%) QRadar
8 1 (1.39%) Single Sign-On
8 1 (1.39%) Symantec Endpoint Protection
Vendors
1 36 (50.00%) Microsoft
2 19 (26.39%) VMware
3 13 (18.06%) Cisco
4 10 (13.89%) IBM
5 8 (11.11%) Oracle
6 7 (9.72%) Veeam
7 4 (5.56%) arcserve
7 4 (5.56%) Google
7 4 (5.56%) SAP
7 4 (5.56%) ServiceNow
8 2 (2.78%) EMC
8 2 (2.78%) F5
8 2 (2.78%) NetApp
8 2 (2.78%) Red Hat
8 2 (2.78%) SolarWinds
8 2 (2.78%) Tenable
9 1 (1.39%) Fortinet
9 1 (1.39%) Qualys
9 1 (1.39%) Splunk
9 1 (1.39%) Veritas