Dynamics 365 Jobs

Microsoft Dynamics 365 (D365)
UK

The table below provides summary statistics for permanent job vacancies requiring Dynamics 365 skills. It includes a benchmarking guide to the annual salaries offered in vacancies that cited Dynamics 365 over the 6 months leading up to 11 October 2024, comparing them to the same period in the previous two years.

6 months to
11 Oct 2024
Same period 2023 Same period 2022
Rank 160 141 328
Rank change year-on-year -19 +187 -49
Permanent jobs citing Dynamics 365 1,336 1,460 1,624
As % of all permanent jobs advertised in the UK 1.71% 2.41% 1.12%
As % of the Cloud Services category 5.49% 5.63% 2.45%
Number of salaries quoted 988 777 1,329
10th Percentile £40,000 £38,183 £36,250
25th Percentile £50,000 £47,500 £46,250
Median annual salary (50th Percentile) £65,000 £60,000 £60,000
Median % change year-on-year +8.33% - +4.35%
75th Percentile £80,000 £72,500 £75,000
90th Percentile £91,625 £90,500 £88,750
UK excluding London median annual salary £65,000 £55,000 £55,000
% change year-on-year +18.18% - +4.76%

All Cloud Skills
UK

Dynamics 365 falls under the Cloud Services category. For comparison with the information above, the following table provides summary statistics for all permanent job vacancies requiring cloud computing skills.

Permanent vacancies with a requirement for cloud computing skills 24,355 25,931 66,337
As % of all permanent jobs advertised in the UK 31.13% 42.83% 45.86%
Number of salaries quoted 14,085 20,209 37,973
10th Percentile £35,000 £33,250 £34,250
25th Percentile £46,250 £45,450 £46,250
Median annual salary (50th Percentile) £65,000 £62,500 £62,500
Median % change year-on-year +4.00% - +4.17%
75th Percentile £82,500 £82,500 £83,750
90th Percentile £102,500 £100,000 £100,000
UK excluding London median annual salary £55,000 £55,000 £55,000
% change year-on-year - - +10.00%

Dynamics 365
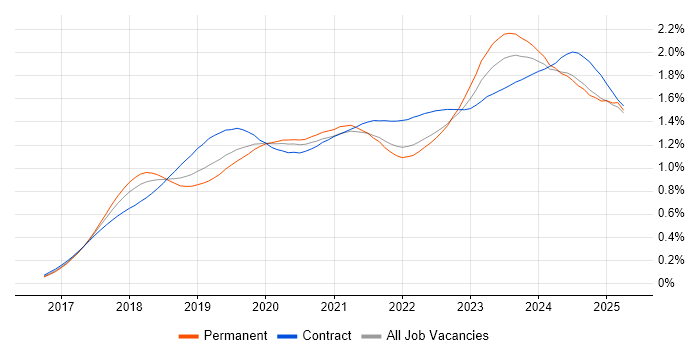
Job Vacancy Trend

Job postings citing Dynamics 365 as a proportion of all IT jobs advertised.

Job vacancy trend for Dynamics 365 in the UK

Dynamics 365
Salary Trend

3-month moving average salary quoted in jobs citing Dynamics 365.

Salary trend for Dynamics 365 in the UK

Dynamics 365
Salary Histogram

Salary distribution for jobs citing Dynamics 365 over the 6 months to 11 October 2024.

Salary histogram for Dynamics 365 in the UK

Dynamics 365
Top 17 Job Locations

The table below looks at the demand and provides a guide to the median salaries quoted in IT jobs citing Dynamics 365 within the UK over the 6 months to 11 October 2024. The 'Rank Change' column provides an indication of the change in demand within each location based on the same 6 month period last year.

Location Rank Change
on Same Period
Last Year
Matching
Permanent
IT Job Ads
Median Salary
Past 6 Months
Median Salary
% Change
on Same Period
Last Year
Live
Jobs
England -6 1,199 £65,000 +8.33% 423
UK excluding London -39 822 £65,000 +18.18% 246
Work from Home -92 447 £65,000 +3.17% 354
London +3 416 £65,000 - 145
North of England +2 260 £65,000 +18.18% 72
Midlands -34 182 £65,000 +10.64% 44
North West -14 157 £65,000 +4.84% 36
West Midlands -3 152 £65,000 +10.64% 39
South East -16 150 £70,000 +31.59% 67
Yorkshire +28 82 £70,000 +40.00% 34
South West -30 79 £57,500 +9.52% 35
East of England -18 64 £55,000 - 8
Scotland -35 60 £45,000 -30.77% 11
East Midlands -75 29 £58,750 -6.00% 5
Wales +3 25 £47,500 +25.46% 7
North East -18 21 £75,000 - 2
Northern Ireland -18 5 £77,500 +82.35% 5

Dynamics 365
Co-occurring Skills and Capabilities by Category

The follow tables expand on the table above by listing co-occurrences grouped by category. The same employment type, locality and period is covered with up to 20 co-occurrences shown in each of the following categories:

Application Platforms
1 108 (8.08%) SharePoint
2 33 (2.47%) Microsoft Exchange
3 12 (0.90%) SharePoint 2010
3 12 (0.90%) SharePoint 2013
4 6 (0.45%) Confluence
5 4 (0.30%) CMS
5 4 (0.30%) OpenEdge
6 3 (0.22%) Adobe Experience Manager
6 3 (0.22%) SAS
6 3 (0.22%) Umbraco
Applications
1 31 (2.32%) Microsoft Office
2 10 (0.75%) Chatbot
3 6 (0.45%) Microsoft Excel
4 4 (0.30%) Trello
5 1 (0.075%) Camtasia
5 1 (0.075%) Microsoft PowerPoint
5 1 (0.075%) MS Visio
Business Applications
1 403 (30.16%) Dynamics CRM
2 54 (4.04%) Dynamics NAV
3 40 (2.99%) Dynamics AX
4 4 (0.30%) Dynamics GP
4 4 (0.30%) iTrent
5 3 (0.22%) Remedy ITSM
5 3 (0.22%) Shopify
5 3 (0.22%) Unit4 Business World
6 2 (0.15%) BambooHR
6 2 (0.15%) Magento
6 2 (0.15%) SAP ERP
6 2 (0.15%) TIBCO iProcess
7 1 (0.075%) Cognos Business Intelligence
7 1 (0.075%) NEC Housing
7 1 (0.075%) Oracle Payables
7 1 (0.075%) Oracle Procure-to-Pay
7 1 (0.075%) Oracle Receivables
7 1 (0.075%) Payment Gateway
7 1 (0.075%) Salesforce CRM
Cloud Services
1 603 (45.13%) Power Platform
2 430 (32.19%) Azure
3 284 (21.26%) PowerApps
4 243 (18.19%) Power Automate
5 162 (12.13%) Microsoft 365
6 107 (8.01%) Azure DevOps
7 88 (6.59%) Azure Logic Apps
8 42 (3.14%) Serverless
9 37 (2.77%) PaaS
10 35 (2.62%) Azure Service Bus
11 34 (2.54%) AWS
11 34 (2.54%) SaaS
12 31 (2.32%) Azure Functions
13 22 (1.65%) Entra ID
14 21 (1.57%) GitHub
15 18 (1.35%) Azure Data Factory
16 15 (1.12%) GCP
16 15 (1.12%) MailChimp
17 10 (0.75%) IaaS
17 10 (0.75%) WhatsApp
Communications & Networking
1 17 (1.27%) Firewall
1 17 (1.27%) LAN
1 17 (1.27%) WAN
2 3 (0.22%) DNS
2 3 (0.22%) Extranet
2 3 (0.22%) MPLS
2 3 (0.22%) Skype
2 3 (0.22%) TCP/IP
2 3 (0.22%) VoIP
3 2 (0.15%) DHCP
3 2 (0.15%) Intranet
3 2 (0.15%) IPsec
3 2 (0.15%) NetScaler
3 2 (0.15%) Network Security
3 2 (0.15%) VPN
3 2 (0.15%) WLAN
4 1 (0.075%) tcpdump
4 1 (0.075%) VPLS
4 1 (0.075%) Wireless
4 1 (0.075%) Wireshark
Database & Business Intelligence
1 206 (15.42%) Power BI
2 65 (4.87%) SQL Server
3 29 (2.17%) SQL Server Integration Services
4 19 (1.42%) Data Lake
5 18 (1.35%) Azure SQL Database
6 16 (1.20%) SQL Server Reporting Services
7 15 (1.12%) Relational Database
8 11 (0.82%) Data Warehouse
9 7 (0.52%) PostgreSQL
10 5 (0.37%) Power Query
10 5 (0.37%) Tableau
11 4 (0.30%) Amazon Redshift
11 4 (0.30%) Apache Cassandra
11 4 (0.30%) SAP HANA
11 4 (0.30%) Star Schema
12 3 (0.22%) Azure SQL Data Warehouse
12 3 (0.22%) Big Data
12 3 (0.22%) Oracle Reports
13 2 (0.15%) MySQL
13 2 (0.15%) RDBMS
Development Applications
1 29 (2.17%) Visual Studio
2 17 (1.27%) Git
3 16 (1.20%) Team Foundation Server
4 15 (1.12%) JIRA
5 3 (0.22%) GitLab
5 3 (0.22%) Jenkins
5 3 (0.22%) Visual Studio Code
6 2 (0.15%) Atlassian Bamboo
6 2 (0.15%) Bitbucket
6 2 (0.15%) Octopus Deploy
6 2 (0.15%) TeamCity
7 1 (0.075%) CircleCI
7 1 (0.075%) Cypress.io
7 1 (0.075%) MSTest
General
1 339 (25.37%) Finance
2 272 (20.36%) Social Skills
3 161 (12.05%) Analytical Skills
4 132 (9.88%) Marketing
5 114 (8.53%) Law
6 66 (4.94%) Public Sector
7 46 (3.44%) Manufacturing
8 43 (3.22%) Retail
9 33 (2.47%) Legal
10 24 (1.80%) Inclusion and Diversity
11 18 (1.35%) General Ledger
12 11 (0.82%) Banking
13 9 (0.67%) Organisational Skills
14 8 (0.60%) Presentation Skills
15 7 (0.52%) Tech for Good
15 7 (0.52%) Telecoms
16 6 (0.45%) Back Office
17 5 (0.37%) Influencing Skills
18 4 (0.30%) Aerospace
19 3 (0.22%) Pharmaceutical
Job Titles
1 332 (24.85%) Developer
2 277 (20.73%) Consultant
3 248 (18.56%) Architect
4 194 (14.52%) Dynamics 365 Consultant
5 186 (13.92%) Dynamics 365 Developer
6 146 (10.93%) Dynamics 365 Architect
7 141 (10.55%) Lead
8 138 (10.33%) Senior
9 121 (9.06%) Solutions Architect
10 119 (8.91%) Analyst
11 100 (7.49%) Functional Consultant
12 81 (6.06%) Dynamics 365 Solution Architect
12 81 (6.06%) Senior Developer
13 75 (5.61%) Power Platform Architect
13 75 (5.61%) Power Platform Developer
14 58 (4.34%) Platform Architect
15 57 (4.27%) Technical Consultant
16 54 (4.04%) Dynamics 365 Analyst
17 52 (3.89%) CRM Consultant
18 45 (3.37%) CRM Developer
Libraries, Frameworks & Software Standards
1 217 (16.24%) .NET
2 43 (3.22%) HTML
3 35 (2.62%) JSON
4 25 (1.87%) CSS
5 21 (1.57%) Web Services
6 20 (1.50%) .NET Framework
7 17 (1.27%) XML
8 16 (1.20%) HTML5 Canvas
9 15 (1.12%) ASP.NET
10 13 (0.97%) Middleware
10 13 (0.97%) REST
11 11 (0.82%) ADO
12 8 (0.60%) .NET Core
12 8 (0.60%) ASP.NET Web API
12 8 (0.60%) EDI
12 8 (0.60%) SOAP
13 7 (0.52%) React
14 6 (0.45%) ARM Templates
14 6 (0.45%) ASP.NET MVC
14 6 (0.45%) RESTful
Miscellaneous
1 50 (3.74%) Management Information System
2 26 (1.95%) Legacy Systems
3 24 (1.80%) Enterprise Software
4 17 (1.27%) Low-Code
5 15 (1.12%) PMI
6 14 (1.05%) Product Ownership
7 12 (0.90%) NHS
8 9 (0.67%) Cloud Native
8 9 (0.67%) Greenfield Project
9 7 (0.52%) Self-Motivation
10 6 (0.45%) Team-Oriented Environment
11 5 (0.37%) Enterprise Cloud
11 5 (0.37%) Legacy Applications
12 4 (0.30%) Data Centre
12 4 (0.30%) Marketing Technology
12 4 (0.30%) Mobile App
12 4 (0.30%) Onboarding
12 4 (0.30%) Virtual Team
13 3 (0.22%) Hackathon
13 3 (0.22%) IoT
Operating Systems
1 40 (2.99%) Windows
2 16 (1.20%) Windows Server
3 10 (0.75%) Windows 10
4 6 (0.45%) Android
5 5 (0.37%) Apple iOS
6 2 (0.15%) VMS
6 2 (0.15%) Windows Server 2012
7 1 (0.075%) Mac OS
7 1 (0.075%) Solaris
7 1 (0.075%) Unix
7 1 (0.075%) Windows Server 2003
7 1 (0.075%) Windows Server 2016
Processes & Methodologies
1 427 (31.96%) CRM
2 205 (15.34%) Agile
3 194 (14.52%) Business Intelligence
4 175 (13.10%) Problem-Solving
5 167 (12.50%) Customer Service
6 161 (12.05%) DevOps
7 160 (11.98%) ERP
8 144 (10.78%) Migration
9 97 (7.26%) CI/CD
10 94 (7.04%) Software Engineering
11 92 (6.89%) Continuous Improvement
12 82 (6.14%) Customer Engagement
13 74 (5.54%) Mentoring
14 72 (5.39%) Data Migration
14 72 (5.39%) Project Delivery
15 69 (5.16%) Project Management
16 64 (4.79%) Roadmaps
17 63 (4.72%) Data Integration
17 63 (4.72%) Presales
18 61 (4.57%) Decision-Making
Programming Languages
1 249 (18.64%) C#
2 156 (11.68%) JavaScript
3 145 (10.85%) SQL
4 30 (2.25%) PowerShell
5 25 (1.87%) TypeScript
6 23 (1.72%) Python
7 17 (1.27%) T-SQL
8 12 (0.90%) X++
9 9 (0.67%) Java
10 6 (0.45%) Data Analysis Expressions
11 3 (0.22%) Bash
11 3 (0.22%) Bicep
11 3 (0.22%) C++
12 2 (0.15%) C
12 2 (0.15%) Go
12 2 (0.15%) Ruby
12 2 (0.15%) VB
12 2 (0.15%) VB6
13 1 (0.075%) VB.NET
13 1 (0.075%) VBScript
Qualifications
1 181 (13.55%) Degree
2 111 (8.31%) Microsoft Certification
3 36 (2.69%) Security Cleared
4 32 (2.40%) Computer Science Degree
5 30 (2.25%) Azure Certification
6 26 (1.95%) SC Cleared
7 21 (1.57%) PMI Certification
8 17 (1.27%) ITIL Certification
9 12 (0.90%) MCITP
9 12 (0.90%) MCSE
10 10 (0.75%) ACCA
10 10 (0.75%) TOGAF Certification
11 6 (0.45%) PMP
12 5 (0.37%) Master's Degree
13 3 (0.22%) MCSA
14 2 (0.15%) CompTIA Security+
15 1 (0.075%) APMG
15 1 (0.075%) CREST Certified
15 1 (0.075%) ITIL Foundation Certificate
15 1 (0.075%) Postgraduate
Quality Assurance & Compliance
1 32 (2.40%) QA
2 29 (2.17%) PMO
2 29 (2.17%) SLA
3 24 (1.80%) Accessibility
4 12 (0.90%) Data Quality
5 6 (0.45%) GDPR
6 3 (0.22%) ISO/IEC 27001
7 2 (0.15%) NIST
7 2 (0.15%) PCI DSS
8 1 (0.075%) Actionable Recommendations
8 1 (0.075%) California Consumer Privacy Act
8 1 (0.075%) HIPAA
System Software
1 68 (5.09%) Active Directory
2 16 (1.20%) Hyper-V
3 15 (1.12%) VMware Infrastructure
4 12 (0.90%) XenApp
4 12 (0.90%) XenDesktop
5 4 (0.30%) Virtual Desktop
5 4 (0.30%) Virtual Machines
6 3 (0.22%) Docker
7 1 (0.075%) Microsoft Virtual Server
7 1 (0.075%) Snort
7 1 (0.075%) Virtual Servers
7 1 (0.075%) VMware NSX
Systems Management
1 35 (2.62%) Microsoft Intune
2 20 (1.50%) SCCM
3 6 (0.45%) Terraform
4 4 (0.30%) Active Directory Federation Services
5 3 (0.22%) Kubernetes
6 1 (0.075%) Ansible
6 1 (0.075%) WSUS
Vendors
1 842 (63.02%) Microsoft
2 27 (2.02%) SAP
3 21 (1.57%) VMware
4 18 (1.35%) Capita
5 15 (1.12%) Oracle
6 14 (1.05%) Google
7 13 (0.97%) Cisco
7 13 (0.97%) HP
8 12 (0.90%) Citrix
8 12 (0.90%) Dell
8 12 (0.90%) Salesforce
8 12 (0.90%) Symantec
9 10 (0.75%) Cognizant
10 8 (0.60%) MuleSoft
10 8 (0.60%) ServiceNow
11 7 (0.52%) Databricks
12 6 (0.45%) Adobe
12 6 (0.45%) HubSpot
12 6 (0.45%) Sophos
13 3 (0.22%) Remedy