Performance Management Jobs

Performance Management
UK

The table below provides summary statistics for permanent job vacancies requiring Performance Management skills. It includes a benchmarking guide to the annual salaries offered in vacancies that cited Performance Management over the 6 months leading up to 11 October 2024, comparing them to the same period in the previous two years.

6 months to
11 Oct 2024
Same period 2023 Same period 2022
Rank 262 392 448
Rank change year-on-year +130 +56 +4
Permanent jobs citing Performance Management 844 467 1,061
As % of all permanent jobs advertised in the UK 1.08% 0.77% 0.73%
As % of the Processes & Methodologies category 1.29% 0.82% 0.76%
Number of salaries quoted 267 306 617
10th Percentile £37,750 £41,250 £39,500
25th Percentile £50,000 £49,000 £47,447
Median annual salary (50th Percentile) £61,305 £65,000 £68,658
Median % change year-on-year -5.68% -5.33% +5.63%
75th Percentile £89,875 £77,715 £88,750
90th Percentile £101,250 £93,125 £110,000
UK excluding London median annual salary £59,511 £62,500 £57,500
% change year-on-year -4.78% +8.70% +4.55%

All Process and Methodology Skills
UK

Performance Management falls under the Processes and Methodologies category. For comparison with the information above, the following table provides summary statistics for all permanent job vacancies requiring process or methodology skills.

Permanent vacancies with a requirement for process or methodology skills 65,317 57,192 139,110
As % of all permanent jobs advertised in the UK 83.49% 94.47% 96.16%
Number of salaries quoted 32,274 40,876 77,262
10th Percentile £33,000 £32,500 £33,950
25th Percentile £43,750 £45,000 £45,000
Median annual salary (50th Percentile) £60,000 £60,000 £60,000
Median % change year-on-year - - +4.35%
75th Percentile £77,500 £80,000 £80,000
90th Percentile £96,250 £97,500 £97,500
UK excluding London median annual salary £52,500 £53,760 £52,500
% change year-on-year -2.34% +2.40% +5.00%

Performance Management
Job Vacancy Trend

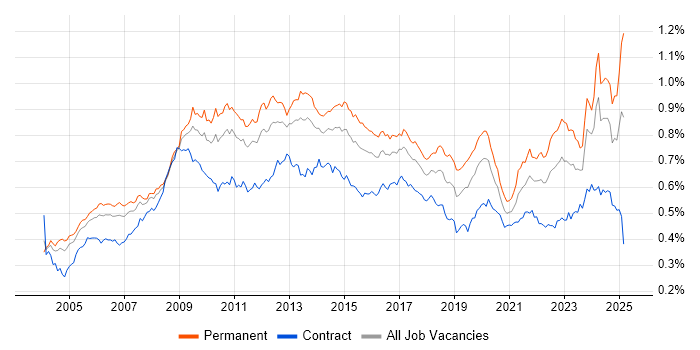
Job postings citing Performance Management as a proportion of all IT jobs advertised.

Job vacancy trend for Performance Management in the UK

Performance Management
Salary Trend

3-month moving average salary quoted in jobs citing Performance Management.

Salary trend for Performance Management in the UK

Performance Management
Salary Histogram

Salary distribution for jobs citing Performance Management over the 6 months to 11 October 2024.

Salary histogram for Performance Management in the UK

Performance Management
Top 17 Job Locations

The table below looks at the demand and provides a guide to the median salaries quoted in IT jobs citing Performance Management within the UK over the 6 months to 11 October 2024. The 'Rank Change' column provides an indication of the change in demand within each location based on the same 6 month period last year.

Location Rank Change
on Same Period
Last Year
Matching
Permanent
IT Job Ads
Median Salary
Past 6 Months
Median Salary
% Change
on Same Period
Last Year
Live
Jobs
England +101 782 £61,903 -4.77% 209
UK excluding London +47 452 £59,511 -4.78% 142
London +169 380 £72,500 -6.45% 82
Work from Home +97 373 £70,000 +7.58% 262
North of England +39 138 £55,000 - 36
North West +36 102 £57,500 -11.63% 24
South East -37 101 £60,000 -8.09% 30
South West +13 68 £87,500 +40.00% 18
Midlands -40 59 £54,000 +2.86% 25
Scotland +26 43 £77,500 +11.60% 11
West Midlands -39 42 £54,000 +2.86% 18
East of England -21 33 £75,000 +15.38% 17
Yorkshire +9 31 £52,500 +5.00% 9
East Midlands -27 17 £70,000 +33.33% 7
Northern Ireland - 8 £36,149 - 8
North East -34 5 £57,965 -17.19% 3
Wales +35 2 £52,500 - 1

Performance Management
Co-occurring Skills and Capabilities by Category

The follow tables expand on the table above by listing co-occurrences grouped by category. The same employment type, locality and period is covered with up to 20 co-occurrences shown in each of the following categories:

Application Platforms
1 180 (21.33%) SAS
2 26 (3.08%) SharePoint
3 7 (0.83%) Microsoft Exchange
4 3 (0.36%) Confluence
4 3 (0.36%) Totara
5 1 (0.12%) BizTalk Server
5 1 (0.12%) Moodle
5 1 (0.12%) NetWeaver
5 1 (0.12%) nginx
5 1 (0.12%) SAP Portal
Applications
1 71 (8.41%) Microsoft Excel
2 59 (6.99%) Microsoft Office
3 9 (1.07%) Microsoft Project
4 8 (0.95%) Microsoft PowerPoint
5 7 (0.83%) Weka
6 5 (0.59%) MS Visio
7 3 (0.36%) AutoCAD
7 3 (0.36%) Spreadsheet
8 2 (0.24%) Adobe Creative Suite
Business Applications
1 173 (20.50%) SAP ERP
2 29 (3.44%) iTrent
3 28 (3.32%) SAP S/4HANA
4 12 (1.42%) Maximo
5 8 (0.95%) Dynamics CRM
6 6 (0.71%) NEC Housing
7 4 (0.47%) Oracle HRMS
8 2 (0.24%) Oracle General Ledger
8 2 (0.24%) Oracle Subledger Accounting
8 2 (0.24%) Primavera
8 2 (0.24%) SAP Business One
9 1 (0.12%) Dynamics NAV
9 1 (0.12%) HFM
9 1 (0.12%) Oracle EBS
9 1 (0.12%) SAP CRM
9 1 (0.12%) SAP GRC
9 1 (0.12%) SAP MDG
Cloud Services
1 46 (5.45%) Azure
2 42 (4.98%) SaaS
3 30 (3.55%) Microsoft 365
3 30 (3.55%) SuccessFactors
4 28 (3.32%) Power Platform
5 25 (2.96%) AWS
6 20 (2.37%) GCP
7 10 (1.18%) Entra ID
8 7 (0.83%) Azure DevOps
8 7 (0.83%) Azure Sentinel
8 7 (0.83%) Cloud Computing
9 6 (0.71%) IaaS
9 6 (0.71%) PaaS
10 5 (0.59%) Serverless
11 4 (0.47%) Azure Monitor
12 3 (0.36%) Amazon S3
12 3 (0.36%) Azure Logic Apps
12 3 (0.36%) GitHub
12 3 (0.36%) Microsoft Purview
13 2 (0.24%) OCI
Communications & Networking
1 173 (20.50%) Broadband
2 21 (2.49%) Firewall
2 21 (2.49%) Wireless
3 16 (1.90%) WAN
4 14 (1.66%) VoIP
4 14 (1.66%) Wi-Fi
5 13 (1.54%) TCP/IP
6 10 (1.18%) LAN
6 10 (1.18%) Network Security
7 9 (1.07%) Internet
7 9 (1.07%) SD-WAN
7 9 (1.07%) VPN
8 5 (0.59%) DNS
9 4 (0.47%) VLAN
10 3 (0.36%) BGP
10 3 (0.36%) Cisco ISE
10 3 (0.36%) EIGRP
10 3 (0.36%) Intrusion Detection
10 3 (0.36%) MPLS
10 3 (0.36%) OSPF
Database & Business Intelligence
1 25 (2.96%) Power BI
2 13 (1.54%) Tableau
3 12 (1.42%) Data Warehouse
4 9 (1.07%) SQL Server
5 7 (0.83%) Amazon QuickSight
6 5 (0.59%) Big Data
6 5 (0.59%) SQL Server Reporting Services
7 4 (0.47%) PostgreSQL
7 4 (0.47%) SAP BW
7 4 (0.47%) SQL Server Integration Services
8 3 (0.36%) NoSQL
9 2 (0.24%) DB2
9 2 (0.24%) DynamoDB
9 2 (0.24%) Power Query
9 2 (0.24%) Tableau Desktop
9 2 (0.24%) Tableau Server
10 1 (0.12%) Azure SQL Data Warehouse
10 1 (0.12%) Data Hub
10 1 (0.12%) MySQL
10 1 (0.12%) Oracle Database
Development Applications
1 12 (1.42%) JIRA
2 4 (0.47%) Gatling
2 4 (0.47%) GitLab
2 4 (0.47%) JMeter
2 4 (0.47%) NeoLoad
3 3 (0.36%) Git
4 2 (0.24%) Bitbucket
4 2 (0.24%) Jenkins
5 1 (0.12%) IntelliJ
5 1 (0.12%) PHPUnit
5 1 (0.12%) webpack
General
1 475 (56.28%) Finance
2 427 (50.59%) Social Skills
3 117 (13.86%) Billing
4 99 (11.73%) Analytical Skills
5 89 (10.55%) Retail
6 80 (9.48%) Presentation Skills
7 57 (6.75%) Legal
8 52 (6.16%) Law
9 48 (5.69%) Manufacturing
10 41 (4.86%) Inclusion and Diversity
11 39 (4.62%) Organisational Skills
12 27 (3.20%) Marketing
12 27 (3.20%) Police
13 25 (2.96%) Public Sector
13 25 (2.96%) Telecoms
14 20 (2.37%) Local Government
15 18 (2.13%) Advertising
16 14 (1.66%) Electronics
17 13 (1.54%) Aerospace
17 13 (1.54%) Influencing Skills
Job Titles
1 180 (21.33%) Architect
2 177 (20.97%) Solutions Architect
3 122 (14.45%) Senior
4 86 (10.19%) Senior Manager
5 81 (9.60%) Analyst
6 70 (8.29%) Lead
7 69 (8.18%) Project Manager
8 41 (4.86%) Infrastructure Manager
9 39 (4.62%) Audit Manager
10 38 (4.50%) Service Manager
11 37 (4.38%) IT Manager
12 30 (3.55%) Senior Infrastructure Manager
13 29 (3.44%) HR Analyst
14 27 (3.20%) Analytics Manager
14 27 (3.20%) SAP Manager
14 27 (3.20%) Senior Analytics Manager
15 25 (2.96%) Team Leader
16 24 (2.84%) Business Manager
17 22 (2.61%) Business Intelligence Manager
18 21 (2.49%) Senior Audit Manager
Libraries, Frameworks & Software Standards
1 22 (2.61%) .NET
2 8 (0.95%) React
3 6 (0.71%) Entity Framework
3 6 (0.71%) WPF
3 6 (0.71%) YAML
4 5 (0.59%) CSS
4 5 (0.59%) HTML
5 4 (0.47%) Node.js
5 4 (0.47%) Spring
6 3 (0.36%) EDI
6 3 (0.36%) Kafka
6 3 (0.36%) Next.js
7 2 (0.24%) ARM Templates
7 2 (0.24%) CSS3
7 2 (0.24%) Flask
7 2 (0.24%) Jest
7 2 (0.24%) Lambda Expressions
7 2 (0.24%) Oracle Fusion
7 2 (0.24%) Spring Boot
7 2 (0.24%) Vue
Miscellaneous
1 102 (12.09%) Management Information System
2 35 (4.15%) Onboarding
3 21 (2.49%) Blog
3 21 (2.49%) Digital Media
4 19 (2.25%) Product Ownership
5 18 (2.13%) Data Centre
6 15 (1.78%) Virtual Team
7 14 (1.66%) Renewable Energy
8 12 (1.42%) CSOC
9 11 (1.30%) Housing Association
9 11 (1.30%) Reinsurance
10 10 (1.18%) Self-Motivation
11 9 (1.07%) Data Structures
11 9 (1.07%) Operational Technology
11 9 (1.07%) Smartphone
11 9 (1.07%) Video Conferencing
12 8 (0.95%) Solar Power
13 7 (0.83%) NHS
14 6 (0.71%) Social Media
15 4 (0.47%) Data Protection Act
Operating Systems
1 42 (4.98%) Windows
2 10 (1.18%) Windows Server
3 8 (0.95%) Linux
4 5 (0.59%) Windows Server 2019
5 4 (0.47%) Windows Vista
6 2 (0.24%) Android
6 2 (0.24%) Apple iOS
6 2 (0.24%) Mac OS
6 2 (0.24%) Windows 10
7 1 (0.12%) Unix
Processes & Methodologies
1 346 (41.00%) Agile
2 232 (27.49%) Change Management
3 227 (26.90%) Roadmaps
4 223 (26.42%) Coaching
5 208 (24.64%) Problem-Solving
6 190 (22.51%) ERP
7 187 (22.16%) Service Management
8 181 (21.45%) Data Management
8 181 (21.45%) Enterprise Architecture
8 181 (21.45%) Strategic Roadmap
9 173 (20.50%) TOGAF
10 146 (17.30%) People Management
11 123 (14.57%) Business Development
12 113 (13.39%) Continuous Improvement
13 104 (12.32%) Project Management
14 101 (11.97%) Mentoring
15 95 (11.26%) Decision-Making
16 92 (10.90%) ITIL
17 86 (10.19%) Business Intelligence
18 80 (9.48%) Stakeholder Management
Programming Languages
1 35 (4.15%) SQL
2 30 (3.55%) VBA
3 18 (2.13%) PL/1
4 15 (1.78%) Python
5 11 (1.30%) PowerShell
6 10 (1.18%) C#
6 10 (1.18%) Java
6 10 (1.18%) JavaScript
6 10 (1.18%) R
7 7 (0.83%) MATLAB
8 6 (0.71%) Assembly Language
8 6 (0.71%) C
8 6 (0.71%) C++
8 6 (0.71%) TypeScript
9 5 (0.59%) Go
10 3 (0.36%) Kusto Query Language
10 3 (0.36%) PHP
10 3 (0.36%) Ruby
11 2 (0.24%) Bash
11 2 (0.24%) Bicep
Qualifications
1 141 (16.71%) ACCA
2 135 (16.00%) Degree
3 28 (3.32%) Security Cleared
4 24 (2.84%) CIMA
5 23 (2.73%) CFA
6 18 (2.13%) SC Cleared
7 13 (1.54%) Master's Degree
8 11 (1.30%) MBA
9 10 (1.18%) PMP
10 9 (1.07%) CCNA
10 9 (1.07%) Cisco Certification
10 9 (1.07%) PMI Certification
11 8 (0.95%) DBS Check
12 7 (0.83%) Network+ Certification
13 5 (0.59%) Computer Science Degree
13 5 (0.59%) Six Sigma Black Belt
14 4 (0.47%) CISSP
14 4 (0.47%) DV Cleared
15 3 (0.36%) CISMP
15 3 (0.36%) PRINCE2 Practitioner
Quality Assurance & Compliance
1 119 (14.10%) GAAP
1 119 (14.10%) IFRS
2 45 (5.33%) QA
3 24 (2.84%) GDPR
4 18 (2.13%) ISO/IEC 27001
4 18 (2.13%) PCI DSS
5 17 (2.01%) Accessibility
6 14 (1.66%) SLA
7 11 (1.30%) Cyber Essentials
8 9 (1.07%) ISO 9001
9 7 (0.83%) Data Quality
9 7 (0.83%) ISO 14001
10 3 (0.36%) Cyber Essentials PLUS
10 3 (0.36%) PMO
11 2 (0.24%) GRC
11 2 (0.24%) NIST
11 2 (0.24%) Sarbanes-Oxley
12 1 (0.12%) HAZOP
System Software
1 17 (2.01%) Active Directory
2 9 (1.07%) Firmware
3 8 (0.95%) Docker
4 7 (0.83%) Hyper-V
5 4 (0.47%) Embedded Firmware
5 4 (0.47%) Virtual Desktop
5 4 (0.47%) VMware Infrastructure
6 1 (0.12%) Virtual Machines
Systems Management
1 9 (1.07%) Terraform
2 7 (0.83%) Kubernetes
2 7 (0.83%) Microsoft Intune
3 5 (0.59%) QRadar
4 4 (0.47%) Grafana
5 3 (0.36%) Prometheus
6 1 (0.12%) HAProxy
6 1 (0.12%) Istio
6 1 (0.12%) Jamf Pro
6 1 (0.12%) linkerd
6 1 (0.12%) SCCM
6 1 (0.12%) ZABBIX
Vendors
1 241 (28.55%) SAP
2 203 (24.05%) Microsoft
3 187 (22.16%) Oracle
4 175 (20.73%) Anaplan
5 174 (20.62%) Hyperion
6 19 (2.25%) Google
7 18 (2.13%) Dynatrace
8 13 (1.54%) IBM
9 10 (1.18%) Cisco
10 9 (1.07%) Avaya
10 9 (1.07%) ServiceNow
11 8 (0.95%) VMware
12 6 (0.71%) Citrix
12 6 (0.71%) Intel
12 6 (0.71%) Motorola
12 6 (0.71%) NEC
12 6 (0.71%) Workday
13 5 (0.59%) Databricks
13 5 (0.59%) IFS
13 5 (0.59%) Meraki