Geographic Information System (GIS)
UK

The following table provides summary statistics for permanent job vacancies with a requirement for GIS skills. Included is a benchmarking guide to the salaries offered in vacancies that have cited GIS over the 6 months to 4 December 2023 with a comparison to the same period in the previous 2 years.

6 months to
4 Dec 2023
Same period 2022 Same period 2021
Rank 609 664 759
Rank change year-on-year +55 +95 -135
Permanent jobs citing GIS 132 446 348
As % of all permanent jobs advertised in the UK 0.25% 0.36% 0.27%
As % of the Database & Business Intelligence category 1.17% 1.55% 1.00%
Number of salaries quoted 103 213 184
10th Percentile £30,650 £30,100 £31,145
25th Percentile £36,500 £33,691 £40,000
Median annual salary (50th Percentile) £44,800 £45,000 £55,000
Median % change year-on-year -0.44% -18.18% +29.41%
75th Percentile £55,200 £67,500 £67,813
90th Percentile £71,500 £75,250 £77,500
UK excluding London median annual salary £44,800 £40,000 £55,000
% change year-on-year +12.00% -27.27% +30.95%

All Database and Business Intelligence Skills
UK

GIS is in the Databases and Business Intelligence category. The following table is for comparison with the above and provides summary statistics for all permanent job vacancies with a requirement for database or business intelligence skills.

Permanent vacancies with a requirement for database or business intelligence skills 11,310 28,707 34,865
As % of all permanent jobs advertised in the UK 21.25% 23.16% 27.19%
Number of salaries quoted 8,502 17,521 22,585
10th Percentile £37,000 £36,750 £35,704
25th Percentile £46,906 £46,250 £42,500
Median annual salary (50th Percentile) £60,000 £62,500 £58,500
Median % change year-on-year -4.00% +6.84% +6.36%
75th Percentile £80,000 £82,500 £77,500
90th Percentile £95,000 £100,000 £95,000
UK excluding London median annual salary £55,000 £55,000 £50,000
% change year-on-year - +10.00% +2.04%

GIS
Job Vacancy Trend

Job postings citing GIS as a proportion of all IT jobs advertised.
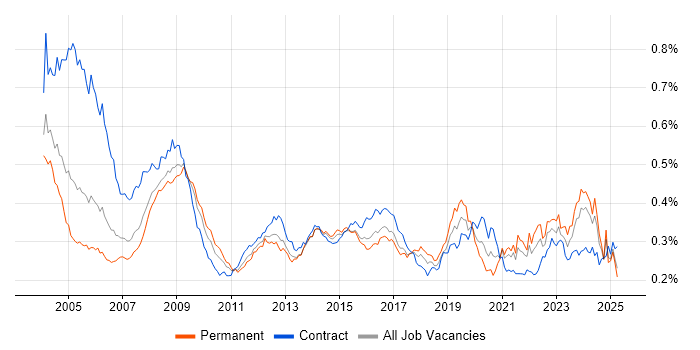
Job vacancy trend for GIS in the UK

GIS
Salary Trend

3-month moving average salary quoted in jobs citing GIS.

Salary trend for GIS in the UK

GIS
Salary Histogram

Salary distribution for jobs citing GIS over the 6 months to 4 December 2023.

Salary histogram for GIS in the UK

GIS
Top 15 Job Locations

The table below looks at the demand and provides a guide to the median salaries quoted in IT jobs citing GIS within the UK over the 6 months to 4 December 2023. The 'Rank Change' column provides an indication of the change in demand within each location based on the same 6 month period last year.

Location Rank Change
on Same Period
Last Year
Matching
Permanent
IT Job Ads
Median Salary
Past 6 Months
Median Salary
% Change
on Same Period
Last Year
Live
Jobs
England +123 111 £45,000 - 91
UK excluding London +47 96 £44,800 +12.00% 88
Work from Home +133 56 £41,000 -21.90% 53
South East +113 30 £45,000 -25.00% 21
South West +26 27 £45,000 +13.92% 10
London +211 20 £45,000 -6.55% 21
West Midlands +110 10 £42,875 +31.92% 3
East of England +106 10 £37,500 -50.00% 11
Midlands +98 10 £42,875 +31.92% 10
North of England +131 9 £47,500 -26.92% 17
North West +100 6 £56,750 +74.62% 10
Wales +16 4 £62,125 +64.87% 1
Yorkshire +81 3 £47,500 -26.92% 5
Scotland +16 3 £44,480 -6.36% 15
Northern Ireland - 3 £40,000 - 3

GIS
Co-occurring Skills and Capabilities by Category

The follow tables expand on the table above by listing co-occurrences grouped by category. The same employment type, locality and period is covered with up to 20 co-occurrences shown in each of the following categories:

Application Platforms
1 27 (20.45%) ArcGIS
2 14 (10.61%) SharePoint
3 4 (3.03%) ArcSDE
4 3 (2.27%) Confluence
5 2 (1.52%) SharePoint 2010
5 2 (1.52%) SharePoint 2013
6 1 (0.76%) Apache
6 1 (0.76%) Apache Airflow
6 1 (0.76%) Apache Spark
6 1 (0.76%) GeoServer
6 1 (0.76%) Jupyter
6 1 (0.76%) Luigi
6 1 (0.76%) MS Exchange
Applications
1 12 (9.09%) Microsoft Excel
2 6 (4.55%) AutoCAD
2 6 (4.55%) Microsoft PowerPoint
3 4 (3.03%) Autodesk Inventor
4 3 (2.27%) Microsoft Office
5 2 (1.52%) 3ds Max
5 2 (1.52%) ArcView
5 2 (1.52%) Blender
5 2 (1.52%) CINEMA 4D
5 2 (1.52%) Microsoft Project
5 2 (1.52%) MicroStation
5 2 (1.52%) SketchUp
5 2 (1.52%) Spreadsheet
Business Applications
1 12 (9.09%) Maximo
2 1 (0.76%) SAP S/4HANA
2 1 (0.76%) Sparx Enterprise Architect
Cloud Services
1 27 (20.45%) Azure
1 27 (20.45%) Power Platform
2 17 (12.88%) Microsoft 365
3 15 (11.36%) Azure DevOps
4 14 (10.61%) SaaS
5 9 (6.82%) PaaS
6 7 (5.30%) GitHub
6 7 (5.30%) IaaS
7 6 (4.55%) AWS
8 4 (3.03%) Serverless
9 2 (1.52%) GCP
9 2 (1.52%) OpenShift
10 1 (0.76%) Amazon EKS
10 1 (0.76%) Cloud Computing
10 1 (0.76%) Google Analytics
Communications & Networking
1 14 (10.61%) Firewall
2 13 (9.85%) Intrusion Detection
2 13 (9.85%) Network Security
3 7 (5.30%) Cisco ISE
3 7 (5.30%) Cisco Nexus
3 7 (5.30%) SD-WAN
4 5 (3.79%) LAN
4 5 (3.79%) WAN
5 4 (3.03%) Intranet
6 3 (2.27%) VPN
7 2 (1.52%) BGP
7 2 (1.52%) IPsec
7 2 (1.52%) NGFW
7 2 (1.52%) OSPF
7 2 (1.52%) Radio Access Network
7 2 (1.52%) Wi-Fi
8 1 (0.76%) DKIM
8 1 (0.76%) DMARC
8 1 (0.76%) DNS
8 1 (0.76%) SMTP
Database & Business Intelligence
1 31 (23.48%) Geospatial Data
2 18 (13.64%) SQL Server
3 17 (12.88%) Power BI
4 13 (9.85%) Data Warehouse
5 11 (8.33%) NoSQL
6 10 (7.58%) QGIS
7 6 (4.55%) Relational Database
7 6 (4.55%) Spatial Data
7 6 (4.55%) Tableau
8 4 (3.03%) Oracle Database
9 3 (2.27%) Looker
10 1 (0.76%) Apache Hive
10 1 (0.76%) Big Data
10 1 (0.76%) Elasticsearch
10 1 (0.76%) Hadoop
10 1 (0.76%) Metadata
10 1 (0.76%) PostgreSQL
10 1 (0.76%) Power Query
Development Applications
1 12 (9.09%) Git
1 12 (9.09%) Team Foundation Server
2 3 (2.27%) Bitbucket
2 3 (2.27%) JIRA
2 3 (2.27%) Visual Studio
3 1 (0.76%) Jenkins
3 1 (0.76%) RStudio
General
1 32 (24.24%) Social Skills
2 21 (15.91%) Finance
3 18 (13.64%) Public Sector
4 13 (9.85%) Analytical Skills
4 13 (9.85%) Manufacturing
5 8 (6.06%) Local Government
6 7 (5.30%) Retail
6 7 (5.30%) Telecoms
7 4 (3.03%) Back Office
7 4 (3.03%) Influencing Skills
7 4 (3.03%) Organisational Skills
7 4 (3.03%) Pharmaceutical
7 4 (3.03%) Police
7 4 (3.03%) Presentation Skills
8 3 (2.27%) Military
9 2 (1.52%) Aerospace
9 2 (1.52%) Aviation
9 2 (1.52%) Banking
9 2 (1.52%) Billing
9 2 (1.52%) Inclusion and Diversity
Job Titles
1 23 (17.42%) Analyst
2 21 (15.91%) Developer
3 12 (9.09%) Data Analyst
4 11 (8.33%) Applications Developer
5 10 (7.58%) GIS Specialist
5 10 (7.58%) Senior
6 9 (6.82%) Consultant
7 7 (5.30%) Architect
7 7 (5.30%) Network Engineer
7 7 (5.30%) Network Security Engineer
7 7 (5.30%) Security Engineer
8 6 (4.55%) Lead
8 6 (4.55%) Service Manager
9 5 (3.79%) GIS Technician
9 5 (3.79%) IT Support
9 5 (3.79%) IT Support Technician
9 5 (3.79%) IT Technician
9 5 (3.79%) Senior Analyst
9 5 (3.79%) Support Technician
9 5 (3.79%) Team Leader
Libraries, Frameworks & Software Standards
1 16 (12.12%) AngularJS
1 16 (12.12%) REST
2 14 (10.61%) .NET
3 10 (7.58%) CSS
3 10 (7.58%) HTML
4 7 (5.30%) XML
5 6 (4.55%) React
6 4 (3.03%) D3.js
6 4 (3.03%) EDI
6 4 (3.03%) JSON
6 4 (3.03%) Middleware
7 3 (2.27%) .NET Core
7 3 (2.27%) ATL
7 3 (2.27%) COM
7 3 (2.27%) Leaflet
8 2 (1.52%) .NET Framework
8 2 (1.52%) ASP.NET MVC
8 2 (1.52%) Blazor
8 2 (1.52%) KML
8 2 (1.52%) Spring Boot
Miscellaneous
1 15 (11.36%) Management Information System
2 5 (3.79%) Enterprise Software
2 5 (3.79%) Photography
2 5 (3.79%) Renewable Energy
3 4 (3.03%) Lidar
3 4 (3.03%) Linux Command Line
3 4 (3.03%) Mobile App
3 4 (3.03%) Operational Technology
4 3 (2.27%) Data Centre
4 3 (2.27%) Driving Licence
5 2 (1.52%) Animation
5 2 (1.52%) Augmented Reality
5 2 (1.52%) FMCG
5 2 (1.52%) Greenfield Project
5 2 (1.52%) IoT
5 2 (1.52%) Motion Graphics
5 2 (1.52%) Robotics
5 2 (1.52%) Self-Motivation
5 2 (1.52%) Solar Energy
5 2 (1.52%) Virtual Reality
Operating Systems
1 14 (10.61%) Windows
2 11 (8.33%) Linux
3 6 (4.55%) Windows Server
4 4 (3.03%) Mac OS
4 4 (3.03%) Unix
4 4 (3.03%) Windows Server 2016
5 3 (2.27%) Windows 10
5 3 (2.27%) Windows Server 2012
5 3 (2.27%) Windows Server 2019
6 1 (0.76%) Mac OS X
Processes & Methodologies
1 27 (20.45%) Business Intelligence
1 27 (20.45%) Decision-Making
2 21 (15.91%) Project Management
2 21 (15.91%) Service Delivery
3 20 (15.15%) Agile
3 20 (15.15%) Data Analysis
4 19 (14.39%) DevOps
5 18 (13.64%) Analytics
5 18 (13.64%) Cybersecurity
5 18 (13.64%) Visualisation
6 15 (11.36%) ITIL
7 14 (10.61%) Asset Management
7 14 (10.61%) Data Management
8 13 (9.85%) Line Management
8 13 (9.85%) Workflow
9 12 (9.09%) Digital Transformation Programme
9 12 (9.09%) Full Stack Development
9 12 (9.09%) Problem-Solving
10 10 (7.58%) Customer Service
10 10 (7.58%) People Management
Programming Languages
1 30 (22.73%) SQL
2 26 (19.70%) Python
3 25 (18.94%) JavaScript
4 14 (10.61%) TypeScript
5 11 (8.33%) C#
6 6 (4.55%) R
7 5 (3.79%) Java
8 4 (3.03%) C
8 4 (3.03%) PowerShell
9 3 (2.27%) C++
10 2 (1.52%) Scala
11 1 (0.76%) Data Analysis Expressions
11 1 (0.76%) MATLAB
11 1 (0.76%) PL/SQL
11 1 (0.76%) Shell Script
11 1 (0.76%) T-SQL
Qualifications
1 40 (30.30%) Degree
2 38 (28.79%) Security Cleared
3 26 (19.70%) SC Cleared
4 10 (7.58%) BPSS Clearance
5 7 (5.30%) CCNA
5 7 (5.30%) Cisco Certification
5 7 (5.30%) CompTIA Security+
5 7 (5.30%) CTC Cleared
6 5 (3.79%) CCNP
6 5 (3.79%) CISSP
7 3 (2.27%) Master's Degree
8 2 (1.52%) HNC
8 2 (1.52%) MCPD
8 2 (1.52%) Microsoft Certification
9 1 (0.76%) Computer Science Degree
9 1 (0.76%) TOGAF Certification
Quality Assurance & Compliance
1 7 (5.30%) Data Quality
1 7 (5.30%) SLA
2 5 (3.79%) ISO/IEC 27001
3 4 (3.03%) PMO
4 2 (1.52%) QA
5 1 (0.76%) Accessibility
5 1 (0.76%) Cyber Essentials
5 1 (0.76%) Cyber Essentials PLUS
5 1 (0.76%) HMG Security Policy Framework
System Software
1 4 (3.03%) VMware Infrastructure
2 3 (2.27%) Virtual Desktop
3 1 (0.76%) Active Directory
3 1 (0.76%) Docker
3 1 (0.76%) VMware ESXi
Systems Management
1 4 (3.03%) Kubernetes
1 4 (3.03%) Terraform
2 1 (0.76%) Ansible
2 1 (0.76%) Nagios
2 1 (0.76%) Oozie
2 1 (0.76%) Progress Chef
2 1 (0.76%) Puppet
Vendors
1 28 (21.21%) ESRI
2 23 (17.42%) Microsoft
3 12 (9.09%) Cisco
4 10 (7.58%) IBM
4 10 (7.58%) SAP
5 7 (5.30%) Aruba
5 7 (5.30%) F5
5 7 (5.30%) Juniper
6 5 (3.79%) Hitachi
6 5 (3.79%) VMware
7 4 (3.03%) Autodesk
7 4 (3.03%) Computacenter
7 4 (3.03%) Oracle
7 4 (3.03%) ServiceNow
8 3 (2.27%) Mapinfo
9 2 (1.52%) MuleSoft
9 2 (1.52%) Sitecore
10 1 (0.76%) Databricks
10 1 (0.76%) Mapbox
10 1 (0.76%) Sparx