Commercial Awareness
UK

The following table provides summary statistics for permanent job vacancies with a requirement for Commercial Awareness skills. Included is a benchmarking guide to the salaries offered in vacancies that have cited Commercial Awareness over the 6 months to 28 November 2023 with a comparison to the same period in the previous 2 years.

6 months to
28 Nov 2023
Same period 2022 Same period 2021
Rank 338 501 513
Rank change year-on-year +163 +12 +39
Permanent jobs citing Commercial Awareness 475 779 712
As % of all permanent jobs advertised in the UK 0.87% 0.62% 0.55%
As % of the Processes & Methodologies category 0.93% 0.65% 0.58%
Number of salaries quoted 161 371 328
10th Percentile £42,500 £42,000 £30,225
25th Percentile £55,542 £51,833 £41,250
Median annual salary (50th Percentile) £70,000 £65,000 £60,000
Median % change year-on-year +7.69% +8.33% +9.09%
75th Percentile £95,000 £82,500 £82,500
90th Percentile £97,500 £96,250 £97,500
UK excluding London median annual salary £64,428 £57,500 £55,000
% change year-on-year +12.05% +4.55% -

All Process and Methodology Skills
UK

Commercial Awareness is in the Processes and Methodologies category. The following table is for comparison with the above and provides summary statistics for all permanent job vacancies with a requirement for process or methodology skills.

Permanent vacancies with a requirement for process or methodology skills 51,121 120,104 122,523
As % of all permanent jobs advertised in the UK 94.09% 95.72% 95.43%
Number of salaries quoted 36,956 73,203 81,032
10th Percentile £32,500 £34,313 £32,500
25th Percentile £43,750 £45,000 £42,500
Median annual salary (50th Percentile) £60,000 £60,000 £59,000
Median % change year-on-year - +1.69% +7.27%
75th Percentile £80,000 £81,250 £77,500
90th Percentile £98,750 £100,000 £95,000
UK excluding London median annual salary £52,500 £53,000 £50,000
% change year-on-year -0.94% +6.00% +4.17%

Commercial Awareness
Job Vacancy Trend

Job postings citing Commercial Awareness as a proportion of all IT jobs advertised.
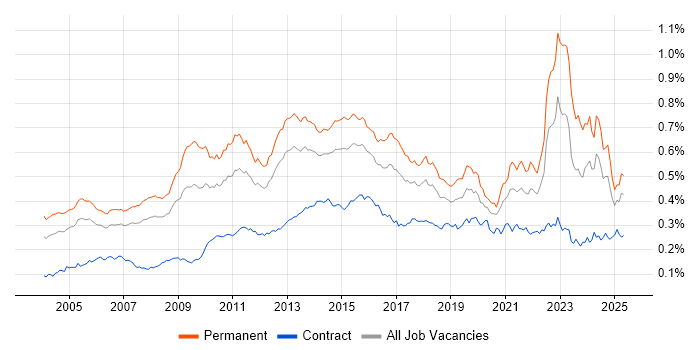
Job vacancy trend for Commercial Awareness in the UK

Commercial Awareness
Salary Trend

3-month moving average salary quoted in jobs citing Commercial Awareness.

Salary trend for Commercial Awareness in the UK

Commercial Awareness
Salary Histogram

Salary distribution for jobs citing Commercial Awareness over the 6 months to 28 November 2023.

Salary histogram for Commercial Awareness in the UK

Commercial Awareness
Top 16 Job Locations

The table below looks at the demand and provides a guide to the median salaries quoted in IT jobs citing Commercial Awareness within the UK over the 6 months to 28 November 2023. The 'Rank Change' column provides an indication of the change in demand within each location based on the same 6 month period last year.

Location Rank Change
on Same Period
Last Year
Matching
Permanent
IT Job Ads
Median Salary
Past 6 Months
Median Salary
% Change
on Same Period
Last Year
Live
Jobs
UK excluding London +141 351 £64,428 +12.05% 200
Work from Home +253 348 £70,000 +7.69% 130
England +121 322 £65,000 - 310
South East +105 87 £67,500 +8.00% 60
North of England +51 75 £52,500 -16.00% 43
London +131 70 £90,000 +24.14% 135
Scotland +72 49 £42,250 -23.02% 18
North West +93 46 £71,049 +20.93% 24
Midlands +92 36 £53,500 -2.73% 28
South West +81 33 £67,500 +22.73% 23
Yorkshire +40 29 £52,500 -4.55% 14
Northern Ireland +63 28 £65,000 - 3
East Midlands +59 24 £72,500 +107.14% 4
Wales +22 24 £58,501 -10.00% 4
East of England +108 19 £65,000 +62.50% 31
West Midlands +69 12 £53,500 -28.67% 23

Commercial Awareness
Co-occurring Skills and Capabilities by Category

The follow tables expand on the table above by listing co-occurrences grouped by category. The same employment type, locality and period is covered with up to 20 co-occurrences shown in each of the following categories:

Application Platforms
1 4 (0.84%) ArcGIS
1 4 (0.84%) ArcSDE
2 2 (0.42%) Confluence
2 2 (0.42%) SharePoint
3 1 (0.21%) Exchange Server 2013
3 1 (0.21%) MS Exchange
Applications
1 12 (2.53%) Microsoft Office
2 7 (1.47%) Spreadsheet
3 4 (0.84%) Autodesk Inventor
3 4 (0.84%) Microsoft Project
4 3 (0.63%) Microsoft Excel
4 3 (0.63%) Microsoft PowerPoint
4 3 (0.63%) Trello
5 1 (0.21%) OrCAD
Business Applications
1 2 (0.42%) Cognos Controller
1 2 (0.42%) Cognos Planning
1 2 (0.42%) IBM Planning Analytics
1 2 (0.42%) SAP SRM
2 1 (0.21%) Raiser's Edge
2 1 (0.21%) SAP CO
2 1 (0.21%) SAP ERP
2 1 (0.21%) SAP FI
2 1 (0.21%) SAP FI/CO
2 1 (0.21%) SAP S/4HANA
2 1 (0.21%) Temenos T24
Cloud Services
1 19 (4.00%) SaaS
2 18 (3.79%) Azure
3 13 (2.74%) AWS
3 13 (2.74%) Dynamics 365
4 11 (2.32%) Microsoft 365
5 9 (1.89%) PaaS
6 8 (1.68%) IaaS
7 5 (1.05%) Entra ID
7 5 (1.05%) GCP
8 4 (0.84%) Azure DevOps
8 4 (0.84%) Azure Sentinel
8 4 (0.84%) Cloud Computing
8 4 (0.84%) Power Platform
9 2 (0.42%) Apigee
9 2 (0.42%) Azure ExpressRoute
9 2 (0.42%) Azure Key Vault
10 1 (0.21%) Google Analytics
10 1 (0.21%) Mimecast
10 1 (0.21%) Slack
10 1 (0.21%) Snowflake
Communications & Networking
1 21 (4.42%) Firewall
2 7 (1.47%) PBX
2 7 (1.47%) VoIP
3 4 (0.84%) Reverse Proxy
4 3 (0.63%) Intrusion Detection
4 3 (0.63%) Unified Communications
5 2 (0.42%) 4G
5 2 (0.42%) 5G
5 2 (0.42%) SAN
5 2 (0.42%) VPN
6 1 (0.21%) 2G
6 1 (0.21%) 3G
6 1 (0.21%) DHCP
6 1 (0.21%) DNS
6 1 (0.21%) GSM
6 1 (0.21%) LAN
6 1 (0.21%) SSL
6 1 (0.21%) TCP/IP
6 1 (0.21%) WAN
6 1 (0.21%) Wireless
Database & Business Intelligence
1 5 (1.05%) GIS
1 5 (1.05%) Tableau
2 4 (0.84%) Power BI
3 3 (0.63%) Data Lake
4 2 (0.42%) Azure SQL Database
4 2 (0.42%) Couchbase
4 2 (0.42%) MongoDB
4 2 (0.42%) NoSQL
4 2 (0.42%) RDBMS
4 2 (0.42%) Relational Database
4 2 (0.42%) SQL Server
5 1 (0.21%) Amazon RDS
5 1 (0.21%) Geospatial Data
5 1 (0.21%) Looker
5 1 (0.21%) Metadata
5 1 (0.21%) SAP HANA
Development Applications
1 6 (1.26%) JIRA
2 1 (0.21%) GitLab
2 1 (0.21%) Jenkins
2 1 (0.21%) Subversion
General
1 342 (72.00%) Social Skills
2 62 (13.05%) Finance
3 40 (8.42%) Manufacturing
4 28 (5.89%) Analytical Skills
5 25 (5.26%) Inclusion and Diversity
6 24 (5.05%) Retail
7 19 (4.00%) Organisational Skills
8 18 (3.79%) Public Sector
9 15 (3.16%) Marketing
10 14 (2.95%) Telecoms
11 13 (2.74%) Influencing Skills
12 12 (2.53%) Presentation Skills
13 11 (2.32%) Electronics
14 7 (1.47%) Financial Institution
14 7 (1.47%) Legal
15 6 (1.26%) Aerospace
16 5 (1.05%) Banking
17 3 (0.63%) Billing
17 3 (0.63%) Law
17 3 (0.63%) Military
Job Titles
1 290 (61.05%) Architect
2 255 (53.68%) Solutions Architect
3 253 (53.26%) Presales Solution Architect
4 37 (7.79%) Senior
5 29 (6.11%) Project Manager
6 23 (4.84%) ServiceNow Architect
7 21 (4.42%) Analyst
8 17 (3.58%) Consultant
8 17 (3.58%) Lead
9 13 (2.74%) Product Manager
10 11 (2.32%) Programme Manager
11 10 (2.11%) Delivery Manager
11 10 (2.11%) IT Manager
12 9 (1.89%) Cybersecurity Consultant
12 9 (1.89%) Security Consultant
12 9 (1.89%) Senior Consultant
12 9 (1.89%) Senior Cybersecurity Consultant
12 9 (1.89%) Senior Security Consultant
13 7 (1.47%) DevOps Engineer
13 7 (1.47%) Technical Architect
Libraries, Frameworks & Software Standards
1 15 (3.16%) EDI
2 2 (0.42%) ARM Templates
3 1 (0.21%) .NET
3 1 (0.21%) D3.js
3 1 (0.21%) JSON
3 1 (0.21%) Leaflet
3 1 (0.21%) Middleware
3 1 (0.21%) OpenLayers
3 1 (0.21%) Series 60
3 1 (0.21%) Velocity
Miscellaneous
1 25 (5.26%) Management Information System
2 14 (2.95%) Product Ownership
3 12 (2.53%) Onboarding
4 9 (1.89%) Cyberattack
5 8 (1.68%) Greenfield Project
6 7 (1.47%) Mobile App
7 6 (1.26%) Blog
8 5 (1.05%) Data Centre
8 5 (1.05%) Enterprise Software
8 5 (1.05%) Hedge funds
8 5 (1.05%) PMI
8 5 (1.05%) Self-Motivation
8 5 (1.05%) Social Media
9 3 (0.63%) Security Posture
9 3 (0.63%) Virtual Team
10 2 (0.42%) Cloud Native
10 2 (0.42%) Smart Meter
11 1 (0.21%) Augmented Reality
11 1 (0.21%) Embedded Systems
11 1 (0.21%) FMCG
Operating Systems
1 8 (1.68%) Linux
1 8 (1.68%) Windows
2 3 (0.63%) Mac OS
3 2 (0.42%) Windows 10
4 1 (0.21%) Android
4 1 (0.21%) Apple iOS
4 1 (0.21%) FreeRTOS
4 1 (0.21%) Windows Server 2012
4 1 (0.21%) Windows Server 2016
Processes & Methodologies
1 295 (62.11%) Problem-Solving
2 275 (57.89%) Business Case
3 273 (57.47%) IT Strategy
4 266 (56.00%) Analytics
5 260 (54.74%) Thought Leadership
6 258 (54.32%) Presales
7 256 (53.89%) Data Analytics
8 255 (53.68%) Digital Transformation Programme
8 255 (53.68%) Technology Strategy
9 253 (53.26%) Actionable Insight
10 252 (53.05%) Contract Negotiation
11 51 (10.74%) Stakeholder Management
12 47 (9.89%) Roadmaps
13 42 (8.84%) Project Management
14 36 (7.58%) Agile
15 35 (7.37%) Project Delivery
16 31 (6.53%) ITIL
17 27 (5.68%) Continuous Improvement
18 24 (5.05%) ITSM
18 24 (5.05%) PRINCE2
Programming Languages
1 13 (2.74%) Python
2 10 (2.11%) SQL
3 9 (1.89%) PowerShell
4 6 (1.26%) JavaScript
5 5 (1.05%) Bash
5 5 (1.05%) C#
5 5 (1.05%) Java
5 5 (1.05%) Kotlin
5 5 (1.05%) TypeScript
6 3 (0.63%) R
7 1 (0.21%) Assembly Language
7 1 (0.21%) C
7 1 (0.21%) C++
7 1 (0.21%) T-SQL
Qualifications
1 284 (59.79%) Security Cleared
2 259 (54.53%) SC Cleared
3 48 (10.11%) Degree
4 14 (2.95%) BPSS Clearance
4 14 (2.95%) DBS Check
5 13 (2.74%) CISA
6 12 (2.53%) CISSP
7 9 (1.89%) CESG Certified Professional
7 9 (1.89%) CRISC
8 7 (1.47%) PMI Certification
8 7 (1.47%) Six Sigma Green Belt
9 5 (1.05%) ACCA
9 5 (1.05%) DV Cleared
9 5 (1.05%) Master's Degree
10 4 (0.84%) Computer Science Degree
10 4 (0.84%) Numerate Degree
11 3 (0.63%) CIMA
11 3 (0.63%) ITIL Certification
11 3 (0.63%) PMP
11 3 (0.63%) Tableau Certification
Quality Assurance & Compliance
1 17 (3.58%) QA
2 12 (2.53%) ISO/IEC 27001
3 11 (2.32%) GRC
3 11 (2.32%) NCSC
3 11 (2.32%) NIST
4 9 (1.89%) NIST 800
5 8 (1.68%) SLA
6 5 (1.05%) GDPR
7 4 (0.84%) Cyber Essentials
7 4 (0.84%) PMO
8 3 (0.63%) COBIT
8 3 (0.63%) ITGC
8 3 (0.63%) Sarbanes-Oxley
9 2 (0.42%) PCI DSS
10 1 (0.21%) Data Quality
10 1 (0.21%) GxP
10 1 (0.21%) ISO 9001
System Software
1 8 (1.68%) Docker
2 6 (1.26%) Virtual Desktop
3 4 (0.84%) Active Directory
4 1 (0.21%) Virtual Machines
Systems Management
1 7 (1.47%) Terraform
2 6 (1.26%) Kubernetes
3 3 (0.63%) Microsoft Intune
4 1 (0.21%) Ansible
4 1 (0.21%) Jamf Pro
4 1 (0.21%) Single Sign-On
4 1 (0.21%) Systems Management Server (SMS)
Vendors
1 55 (11.58%) Microsoft
2 23 (4.84%) ServiceNow
3 14 (2.95%) Sun
4 7 (1.47%) SAP
5 5 (1.05%) Citrix
5 5 (1.05%) ESRI
5 5 (1.05%) Google
5 5 (1.05%) HubSpot
5 5 (1.05%) Salesforce
6 4 (0.84%) Autodesk
7 3 (0.63%) Ariba
7 3 (0.63%) Cisco
8 2 (0.42%) Cognos
8 2 (0.42%) Lets Encrypt
8 2 (0.42%) Okta
9 1 (0.21%) Apple
9 1 (0.21%) Concur
9 1 (0.21%) Dell
9 1 (0.21%) Mapbox
9 1 (0.21%) MuleSoft