Business Cases
UK

The following table provides summary statistics for permanent job vacancies with a requirement for Business Case skills. Included is a benchmarking guide to the salaries offered in vacancies that have cited Business Case over the 6 months to 5 December 2023 with a comparison to the same period in the previous 2 years.

6 months to
5 Dec 2023
Same period 2022 Same period 2021
Rank 155 199 270
Rank change year-on-year +44 +71 +63
Permanent jobs citing Business Case 1,190 2,421 1,762
As % of all permanent jobs advertised in the UK 2.23% 1.95% 1.38%
As % of the Processes & Methodologies category 2.37% 2.04% 1.45%
Number of salaries quoted 642 1,442 1,112
10th Percentile £41,505 £41,250 £40,625
25th Percentile £51,283 £50,000 £46,250
Median annual salary (50th Percentile) £65,000 £62,500 £60,000
Median % change year-on-year +4.00% +4.17% -
75th Percentile £87,500 £77,500 £77,500
90th Percentile £107,500 £92,375 £95,000
UK excluding London median annual salary £55,000 £57,500 £52,500
% change year-on-year -4.35% +9.52% -

All Process and Methodology Skills
UK

Business Case is in the Processes and Methodologies category. The following table is for comparison with the above and provides summary statistics for all permanent job vacancies with a requirement for process or methodology skills.

Permanent vacancies with a requirement for process or methodology skills 50,261 118,879 121,556
As % of all permanent jobs advertised in the UK 94.08% 95.74% 95.44%
Number of salaries quoted 36,398 72,456 81,203
10th Percentile £32,500 £34,500 £32,500
25th Percentile £43,750 £45,000 £42,500
Median annual salary (50th Percentile) £60,000 £60,000 £60,000
Median % change year-on-year - - +9.09%
75th Percentile £80,000 £82,500 £77,500
90th Percentile £100,000 £100,000 £95,000
UK excluding London median annual salary £52,500 £53,500 £50,000
% change year-on-year -1.87% +7.00% +4.17%

Business Case
Job Vacancy Trend

Job postings citing Business Case as a proportion of all IT jobs advertised.
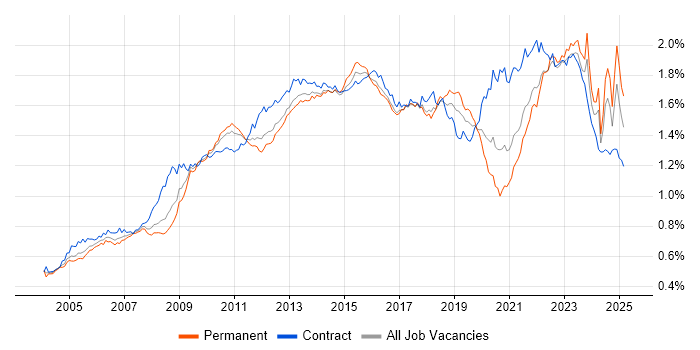
Job vacancy trend for Business Case in the UK

Business Case
Salary Trend

3-month moving average salary quoted in jobs citing Business Case.

Salary trend for Business Case in the UK

Business Case
Salary Histogram

Salary distribution for jobs citing Business Case over the 6 months to 5 December 2023.

Salary histogram for Business Case in the UK

Business Case
Top 17 Job Locations

The table below looks at the demand and provides a guide to the median salaries quoted in IT jobs citing Business Case within the UK over the 6 months to 5 December 2023. The 'Rank Change' column provides an indication of the change in demand within each location based on the same 6 month period last year.

Location Rank Change
on Same Period
Last Year
Matching
Permanent
IT Job Ads
Median Salary
Past 6 Months
Median Salary
% Change
on Same Period
Last Year
Live
Jobs
England +30 980 £65,000 +4.00% 440
UK excluding London +20 709 £55,000 -4.35% 252
Work from Home +106 646 £65,000 +1.56% 184
London +53 389 £75,000 +7.14% 220
North of England +82 164 £55,000 +2.98% 53
South East -36 156 £60,000 - 65
South West +13 107 £62,500 +13.64% 33
Midlands +50 104 £54,000 -7.69% 47
North West +83 100 £55,000 -3.51% 32
Scotland +71 84 £38,250 -24.63% 24
Yorkshire +84 60 £55,000 +5.26% 17
West Midlands +35 52 £54,000 -7.69% 28
East Midlands +52 51 £54,000 -8.47% 19
Wales +21 35 £50,932 -12.12% 10
East of England +35 32 £54,000 -10.00% 25
Northern Ireland +60 27 - - 6
North East +30 4 £57,500 +43.75% 5

Business Case
Co-occurring Skills and Capabilities by Category

The follow tables expand on the table above by listing co-occurrences grouped by category. The same employment type, locality and period is covered with up to 20 co-occurrences shown in each of the following categories:

Application Platforms
1 20 (1.68%) SharePoint
2 9 (0.76%) Confluence
3 6 (0.50%) MS Exchange
4 5 (0.42%) IIS
5 3 (0.25%) Appian
6 2 (0.17%) Adobe Experience Manager
6 2 (0.17%) Oracle SOA Suite
6 2 (0.17%) Oracle Workflow
7 1 (0.084%) ArcGIS
7 1 (0.084%) MS Project Server
7 1 (0.084%) OpenStack
Applications
1 62 (5.21%) Microsoft Office
2 58 (4.87%) Microsoft Excel
3 42 (3.53%) Microsoft Project
4 33 (2.77%) MS Visio
5 32 (2.69%) Microsoft PowerPoint
6 7 (0.59%) Spreadsheet
7 1 (0.084%) Trello
Business Applications
1 12 (1.01%) Sparx Enterprise Architect
2 8 (0.67%) Endur
2 8 (0.67%) SAP S/4HANA
3 7 (0.59%) Dynamics CRM
4 5 (0.42%) BusinessWorks
5 2 (0.17%) Oracle Financials
5 2 (0.17%) SAP ERP
6 1 (0.084%) Dynamics AX
6 1 (0.084%) Magento
6 1 (0.084%) Oracle EBS
6 1 (0.084%) Oracle Procure-to-Pay
6 1 (0.084%) Salesforce CRM
6 1 (0.084%) SAP BPC
6 1 (0.084%) SAP CX
6 1 (0.084%) SAP IBP
6 1 (0.084%) SAP SD
6 1 (0.084%) Temenos T24
Cloud Services
1 196 (16.47%) Azure
2 109 (9.16%) AWS
3 63 (5.29%) Microsoft 365
4 42 (3.53%) Power Platform
5 36 (3.03%) Azure DevOps
6 35 (2.94%) SaaS
7 22 (1.85%) GCP
8 14 (1.18%) GitHub
9 10 (0.84%) dbt
10 9 (0.76%) PaaS
11 8 (0.67%) Dynamics 365
12 6 (0.50%) Boomi
12 6 (0.50%) Entra ID
12 6 (0.50%) Power Automate
12 6 (0.50%) PowerApps
12 6 (0.50%) WhatsApp
13 5 (0.42%) IaaS
14 4 (0.34%) Microsoft Purview
15 2 (0.17%) Amazon EMR
15 2 (0.17%) Azure API Management
Communications & Networking
1 36 (3.03%) VPN
2 27 (2.27%) Firewall
3 15 (1.26%) LAN
4 14 (1.18%) Network Security
5 9 (0.76%) VoIP
5 9 (0.76%) WAN
6 8 (0.67%) Internet
7 7 (0.59%) PBX
8 6 (0.50%) TCP/IP
9 5 (0.42%) BGP
9 5 (0.42%) OSPF
9 5 (0.42%) SD-WAN
9 5 (0.42%) Unified Communications
9 5 (0.42%) Wi-Fi
10 4 (0.34%) DNS
10 4 (0.34%) MPLS
10 4 (0.34%) Wireless
11 3 (0.25%) DHCP
11 3 (0.25%) VLAN
12 2 (0.17%) Reverse Proxy
Database & Business Intelligence
1 94 (7.90%) Data Warehouse
2 19 (1.60%) Big Data
2 19 (1.60%) Power BI
3 12 (1.01%) Metadata
3 12 (1.01%) SQL Server Reporting Services
4 11 (0.92%) SQL Server
5 7 (0.59%) Data Vault
5 7 (0.59%) SQL Server Integration Services
6 6 (0.50%) BigQuery
6 6 (0.50%) Crystal Reports
6 6 (0.50%) Oracle Database
6 6 (0.50%) Relational Database
6 6 (0.50%) Tableau
7 5 (0.42%) GIS
7 5 (0.42%) NoSQL
8 4 (0.34%) Data Lake
8 4 (0.34%) Data Mart
8 4 (0.34%) MongoDB
8 4 (0.34%) Oracle Database 12c
8 4 (0.34%) SAP BW
Development Applications
1 27 (2.27%) JIRA
2 14 (1.18%) Jenkins
3 4 (0.34%) Oracle Forms
4 2 (0.17%) Subversion
5 1 (0.084%) Balsamiq
5 1 (0.084%) Git
5 1 (0.084%) GitLab
5 1 (0.084%) Selenium
5 1 (0.084%) TestNG
General
1 506 (42.52%) Social Skills
2 363 (30.50%) Finance
3 138 (11.60%) Analytical Skills
4 126 (10.59%) Public Sector
5 97 (8.15%) Retail
6 72 (6.05%) Inclusion and Diversity
7 56 (4.71%) Presentation Skills
8 53 (4.45%) Influencing Skills
9 42 (3.53%) Legal
10 35 (2.94%) Law
10 35 (2.94%) Marketing
10 35 (2.94%) Organisational Skills
11 31 (2.61%) Manufacturing
12 28 (2.35%) Telecoms
13 27 (2.27%) Publishing
14 26 (2.18%) Banking
15 18 (1.51%) Documentation Skills
15 18 (1.51%) Local Government
16 13 (1.09%) Back Office
17 10 (0.84%) Automotive
Job Titles
1 415 (34.87%) Architect
2 358 (30.08%) Solutions Architect
3 244 (20.50%) Presales Solution Architect
4 207 (17.39%) Analyst
5 164 (13.78%) Senior
6 161 (13.53%) Project Manager
7 145 (12.18%) Business Analyst
8 77 (6.47%) IT Manager
8 77 (6.47%) Senior Architect
9 75 (6.30%) Senior Solutions Architect
10 73 (6.13%) Lead
11 56 (4.71%) Consultant
12 54 (4.54%) IT Project Manager
13 43 (3.61%) IT Analyst
14 39 (3.28%) IT Support
15 36 (3.03%) Programme Manager
16 34 (2.86%) Senior Manager
17 30 (2.52%) IT Support Analyst
17 30 (2.52%) Support Analyst
18 28 (2.35%) Data Architect
Libraries, Frameworks & Software Standards
1 23 (1.93%) .NET
2 21 (1.76%) REST
3 12 (1.01%) JSON
4 8 (0.67%) ADO
4 8 (0.67%) ARM Templates
4 8 (0.67%) Web Services
5 7 (0.59%) SOAP
6 4 (0.34%) EDI
7 2 (0.17%) Django
7 2 (0.17%) SAP Fiori
7 2 (0.17%) XMPP
8 1 (0.084%) HTML
8 1 (0.084%) IDoc
8 1 (0.084%) J2EE
8 1 (0.084%) Velocity
8 1 (0.084%) XML
Miscellaneous
1 86 (7.23%) Cloud Native
2 80 (6.72%) Data Structures
3 67 (5.63%) Self-Motivation
4 52 (4.37%) Data Centre
5 48 (4.03%) Management Information System
6 43 (3.61%) Product Ownership
7 20 (1.68%) Enterprise Software
7 20 (1.68%) Onboarding
7 20 (1.68%) PKI
8 18 (1.51%) Hybrid Cloud
9 16 (1.34%) NHS
10 15 (1.26%) Social Media
11 14 (1.18%) Public Cloud
12 13 (1.09%) IoT
13 12 (1.01%) Blockchain
13 12 (1.01%) Robotics
14 11 (0.92%) Greenfield Project
14 11 (0.92%) Renewable Energy
15 10 (0.84%) Culture of Ownership
16 9 (0.76%) Blog
Operating Systems
1 42 (3.53%) Windows
2 16 (1.34%) AIX
3 7 (0.59%) Linux
3 7 (0.59%) Unix
4 2 (0.17%) Windows Server
5 1 (0.084%) Oracle Linux
5 1 (0.084%) VMS
5 1 (0.084%) Windows Server 2012
5 1 (0.084%) Windows Server 2016
5 1 (0.084%) Windows Server 2019
Processes & Methodologies
1 409 (34.37%) Agile
2 362 (30.42%) Presales
3 361 (30.34%) Problem-Solving
4 348 (29.24%) Analytics
5 340 (28.57%) Actionable Insight
6 295 (24.79%) IT Strategy
7 280 (23.53%) Data Analytics
8 274 (23.03%) Technology Strategy
9 262 (22.02%) Commercial Awareness
10 260 (21.85%) Digital Transformation Programme
10 260 (21.85%) Project Management
11 258 (21.68%) Thought Leadership
12 246 (20.67%) Contract Negotiation
13 231 (19.41%) Stakeholder Management
14 194 (16.30%) Project Delivery
15 162 (13.61%) Roadmaps
16 145 (12.18%) Business Analysis
16 145 (12.18%) Change Management
17 132 (11.09%) Enterprise Architecture
18 122 (10.25%) Scrum
Programming Languages
1 48 (4.03%) SQL
2 17 (1.43%) Python
3 14 (1.18%) C#
4 10 (0.84%) PL/SQL
5 9 (0.76%) JavaScript
6 8 (0.67%) Bicep
7 6 (0.50%) MATLAB
7 6 (0.50%) PowerShell
8 5 (0.42%) R
9 4 (0.34%) C++
9 4 (0.34%) Java
10 2 (0.17%) VBA
11 1 (0.084%) Kusto Query Language
Qualifications
1 384 (32.27%) Security Cleared
2 293 (24.62%) SC Cleared
3 199 (16.72%) Degree
4 98 (8.24%) TOGAF Certification
5 56 (4.71%) DV Cleared
6 29 (2.44%) CISSP
7 20 (1.68%) Master's Degree
8 19 (1.60%) PMI Certification
9 17 (1.43%) Azure Certification
9 17 (1.43%) ISSAP
9 17 (1.43%) Microsoft Certification
10 16 (1.34%) BPSS Clearance
11 15 (1.26%) PMP
12 11 (0.92%) Cisco Certification
13 9 (0.76%) CISM
13 9 (0.76%) Computer Science Degree
14 8 (0.67%) CESG Certified Professional
14 8 (0.67%) IIBA
14 8 (0.67%) PRINCE2 Practitioner
15 7 (0.59%) AWS Certification
Quality Assurance & Compliance
1 65 (5.46%) QA
2 57 (4.79%) PMO
3 30 (2.52%) Data Quality
4 19 (1.60%) ISO/IEC 27001
5 12 (1.01%) GDPR
6 9 (0.76%) Cyber Essentials
6 9 (0.76%) SLA
7 8 (0.67%) Cyber Essentials PLUS
8 6 (0.50%) HMG Security Policy Framework
8 6 (0.50%) IASME
8 6 (0.50%) JSP 440
9 4 (0.34%) IFRS
10 2 (0.17%) NIST
11 1 (0.084%) GxP
11 1 (0.084%) NCSC
11 1 (0.084%) PCI DSS
System Software
1 19 (1.60%) Active Directory
2 7 (0.59%) VMware Infrastructure
3 3 (0.25%) Hyper-V
3 3 (0.25%) IAG
4 2 (0.17%) KVM
4 2 (0.17%) Virtual Desktop
5 1 (0.084%) Terminal Services
5 1 (0.084%) Virtual Machines
5 1 (0.084%) VMware ESXi
5 1 (0.084%) XenApp
5 1 (0.084%) XenDesktop
Systems Management
1 37 (3.11%) SCCM
2 12 (1.01%) Terraform
3 7 (0.59%) Kubernetes
4 3 (0.25%) Ansible
5 2 (0.17%) Cisco CUCM
6 1 (0.084%) Grafana
6 1 (0.084%) HP ALM
6 1 (0.084%) Progress Chef
6 1 (0.084%) Puppet
6 1 (0.084%) Rancher
6 1 (0.084%) Single Sign-On
Vendors
1 156 (13.11%) Microsoft
2 39 (3.28%) SAP
3 32 (2.69%) Dell
3 32 (2.69%) HP
4 31 (2.61%) Bloomberg
5 27 (2.27%) Oracle
6 13 (1.09%) Google
7 12 (1.01%) Cisco
7 12 (1.01%) Sparx
8 11 (0.92%) ServiceNow
9 10 (0.84%) IFS
9 10 (0.84%) Informatica
10 9 (0.76%) VMware
11 8 (0.67%) Salesforce
12 5 (0.42%) Databricks
12 5 (0.42%) Palo Alto
12 5 (0.42%) TIBCO
13 4 (0.34%) Citrix
13 4 (0.34%) OpenAI
14 3 (0.25%) Adobe