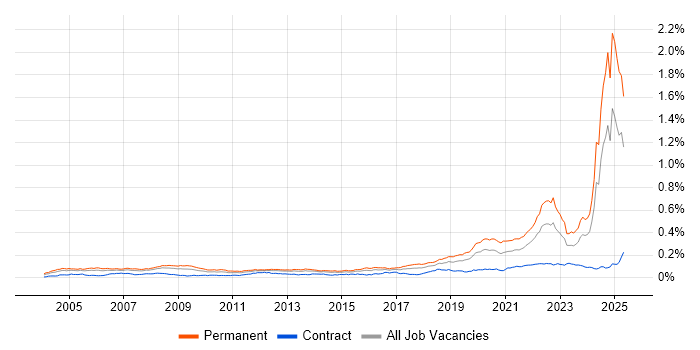
Engineering Manager
UK
The median Engineering Manager salary in the UK is £61,500 per year, according to job vacancies posted during the 6 months leading to 30 May 2025.
The table below provides salary benchmarking and summary statistics, comparing them to the same period in the previous two years.
| 6 months to 30 May 2025 |
Same period 2024 | Same period 2023 | |
|---|---|---|---|
| Rank | 173 | 397 | 571 |
| Rank change year-on-year | +224 | +174 | +25 |
| Permanent jobs requiring an Engineering Manager | 1,047 | 650 | 440 |
| As % of all permanent jobs advertised in the UK | 1.89% | 0.63% | 0.45% |
| As % of the Job Titles category | 2.09% | 0.66% | 0.50% |
| Number of salaries quoted | 375 | 273 | 253 |
| 10th Percentile | - | £57,500 | £62,100 |
| 25th Percentile | £7,000 | £63,750 | £75,000 |
| Median annual salary (50th Percentile) | £61,500 | £75,000 | £95,000 |
| Median % change year-on-year | -18.00% | -21.05% | -5.00% |
| 75th Percentile | £74,375 | £100,000 | £115,000 |
| 90th Percentile | £97,500 | £117,500 | £139,500 |
| UK excluding London median annual salary | £61,500 | £70,000 | £77,500 |
| % change year-on-year | -12.14% | -9.68% | -16.22% |
All Permanent IT Job Vacancies
UK
For comparison with the information above, the following table provides summary statistics for all permanent IT job vacancies. Most job vacancies include a discernible job title that can be normalized. As such, the figures in the second row provide an indication of the number of permanent jobs in our overall sample.
| Permanent vacancies in the UK with a recognized job title | 50,066 | 97,923 | 88,829 |
| % of permanent jobs with a recognized job title | 90.36% | 94.81% | 91.43% |
| Number of salaries quoted | 26,124 | 69,761 | 56,179 |
| 10th Percentile | £28,750 | £28,500 | £32,500 |
| 25th Percentile | £40,750 | £38,500 | £45,000 |
| Median annual salary (50th Percentile) | £55,000 | £52,500 | £60,000 |
| Median % change year-on-year | +4.76% | -12.50% | - |
| 75th Percentile | £73,750 | £70,000 | £80,000 |
| 90th Percentile | £95,000 | £90,000 | £100,000 |
| UK excluding London median annual salary | £51,000 | £50,000 | £53,500 |
| % change year-on-year | +2.00% | -6.54% | +6.63% |
Engineering Manager
Job Vacancy Trend
Job postings that featured Engineering Manager in the job title as a proportion of all IT jobs advertised.

Engineering Manager
Salary Trend
3-month moving average salary quoted in jobs citing Engineering Manager.
Engineering Manager
Salary Histogram
Salary distribution for jobs citing Engineering Manager over the 6 months to 30 May 2025.
Engineering Manager
Top 16 Job Locations
The table below looks at the demand and provides a guide to the median salaries quoted in IT jobs citing Engineering Manager within the UK over the 6 months to 30 May 2025. The 'Rank Change' column provides an indication of the change in demand within each location based on the same 6 month period last year.
| Location | Rank Change on Same Period Last Year |
Matching Permanent IT Job Ads |
Median Salary Past 6 Months |
Median Salary % Change on Same Period Last Year |
Live Jobs |
|---|---|---|---|---|---|
| England | +311 | 920 | £61,500 | -25.45% | 767 |
| UK excluding London | +214 | 834 | £61,500 | -12.14% | 755 |
| North of England | +222 | 313 | £7,000 | -91.52% | 167 |
| North West | +154 | 244 | £7,000 | -91.52% | 89 |
| Work from Home | +192 | 243 | £85,000 | +21.43% | 254 |
| South East | +182 | 203 | £70,000 | +7.69% | 247 |
| London | +94 | 120 | £97,500 | -3.70% | 111 |
| Midlands | +143 | 97 | £72,500 | +3.57% | 126 |
| Scotland | +12 | 79 | £75,000 | +7.14% | 36 |
| South West | +99 | 64 | £80,000 | +6.67% | 84 |
| Yorkshire | +104 | 61 | £82,500 | - | 58 |
| East Midlands | +90 | 56 | £71,250 | - | 51 |
| East of England | +95 | 50 | - | - | 91 |
| West Midlands | +73 | 41 | £75,000 | +7.14% | 63 |
| Wales | - | 28 | £70,000 | - | 26 |
| North East | +50 | 8 | £67,500 | -3.57% | 20 |
Engineering Manager Skill Set
Top 30 Co-occurring Skills and Capabilities
For the 6 months to 30 May 2025, Engineering Manager job roles required the following skills and capabilities in order of popularity. The figures indicate the absolute number co-occurrences and as a proportion of all permanent job ads featuring Engineering Manager in the job title.
|
|
Engineering Manager Skill Set
Co-occurring Skills and Capabilities by Category
The follow tables expand on the table above by listing co-occurrences grouped by category. The same employment type, locality and period is covered with up to 20 co-occurrences shown in each of the following categories:
|
|
||||||||||||||||||||||||||||||||||||||||||||||||||||||||||||||||||||||||||||||||||||||||||||||||||||||||||||||||||||||||||||||
|
|
||||||||||||||||||||||||||||||||||||||||||||||||||||||||||||||||||||||||||||||||||||||||||||||||||||||||||||||||||||||||||||||
|
|
||||||||||||||||||||||||||||||||||||||||||||||||||||||||||||||||||||||||||||||||||||||||||||||||||||||||||||||||||||||||||||||
|
|
||||||||||||||||||||||||||||||||||||||||||||||||||||||||||||||||||||||||||||||||||||||||||||||||||||||||||||||||||||||||||||||
|
|
||||||||||||||||||||||||||||||||||||||||||||||||||||||||||||||||||||||||||||||||||||||||||||||||||||||||||||||||||||||||||||||
|
|
||||||||||||||||||||||||||||||||||||||||||||||||||||||||||||||||||||||||||||||||||||||||||||||||||||||||||||||||||||||||||||||
|
|
||||||||||||||||||||||||||||||||||||||||||||||||||||||||||||||||||||||||||||||||||||||||||||||||||||||||||||||||||||||||||||||
|
|
||||||||||||||||||||||||||||||||||||||||||||||||||||||||||||||||||||||||||||||||||||||||||||||||||||||||||||||||||||||||||||||
|
|
||||||||||||||||||||||||||||||||||||||||||||||||||||||||||||||||||||||||||||||||||||||||||||||||||||||||||||||||||||||||||||||
