Microsoft Visio
UK

The following table provides summary statistics for permanent job vacancies with a requirement for MS Visio skills. Included is a benchmarking guide to the salaries offered in vacancies that have cited MS Visio over the 6 months to 10 December 2023 with a comparison to the same period in the previous 2 years.

6 months to
10 Dec 2023
Same period 2022 Same period 2021
Rank 498 438 502
Rank change year-on-year -60 +64 -36
Permanent jobs citing MS Visio 243 883 736
As % of all permanent jobs advertised in the UK 0.46% 0.72% 0.58%
As % of the Applications category 5.78% 7.92% 6.81%
Number of salaries quoted 204 490 576
10th Percentile £37,363 £33,750 £32,500
25th Percentile £45,688 £43,173 £39,000
Median annual salary (50th Percentile) £60,000 £57,500 £50,000
Median % change year-on-year +4.35% +15.00% -
75th Percentile £70,000 £70,000 £68,500
90th Percentile £80,000 £82,500 £81,250
UK excluding London median annual salary £46,000 £50,000 £45,000
% change year-on-year -8.00% +11.11% -

All Software Application Skills
UK

MS Visio is in the Software Applications category. The following table is for comparison with the above and provides summary statistics for all permanent job vacancies with a requirement for software application skills.

Permanent vacancies with a requirement for software application skills 4,205 11,143 10,811
As % of all permanent jobs advertised in the UK 8.04% 9.12% 8.51%
Number of salaries quoted 2,965 6,271 6,766
10th Percentile £25,390 £26,250 £25,750
25th Percentile £30,000 £32,000 £31,250
Median annual salary (50th Percentile) £42,500 £45,750 £44,107
Median % change year-on-year -7.10% +3.73% +3.78%
75th Percentile £60,000 £61,088 £60,000
90th Percentile £72,500 £78,750 £75,000
UK excluding London median annual salary £37,500 £38,250 £37,500
% change year-on-year -1.96% +2.00% -

MS Visio
Job Vacancy Trend

Job postings citing MS Visio as a proportion of all IT jobs advertised.
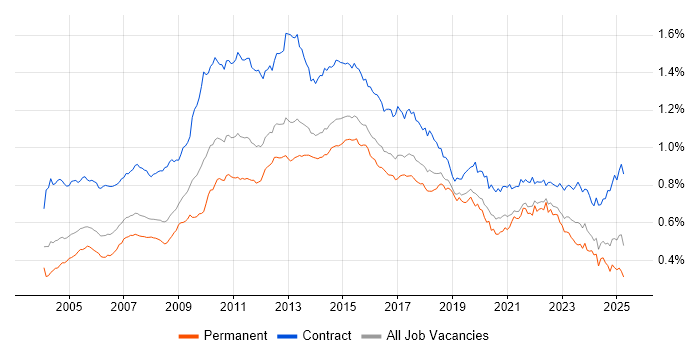
Job vacancy trend for MS Visio in the UK

MS Visio
Salary Trend

3-month moving average salary quoted in jobs citing MS Visio.

Salary trend for MS Visio in the UK

MS Visio
Salary Histogram

Salary distribution for jobs citing MS Visio over the 6 months to 10 December 2023.

Salary histogram for MS Visio in the UK

MS Visio
Top 15 Job Locations

The table below looks at the demand and provides a guide to the median salaries quoted in IT jobs citing MS Visio within the UK over the 6 months to 10 December 2023. The 'Rank Change' column provides an indication of the change in demand within each location based on the same 6 month period last year.

Location Rank Change
on Same Period
Last Year
Matching
Permanent
IT Job Ads
Median Salary
Past 6 Months
Median Salary
% Change
on Same Period
Last Year
Live
Jobs
England -50 229 £60,000 +9.09% 152
UK excluding London -52 119 £46,000 -8.00% 91
London +79 115 £67,500 +3.85% 64
Work from Home -8 104 £57,500 - 62
South East +66 37 £47,500 -9.52% 35
North of England +43 31 £46,000 +2.22% 19
South West +38 22 £45,000 -3.23% 5
Midlands +62 20 £55,000 +4.76% 19
Yorkshire +52 17 £42,000 -16.00% 5
West Midlands +66 14 £55,000 +10.00% 16
North West +67 11 £46,000 +15.72% 8
Scotland +14 6 £46,000 -42.50% 8
East Midlands +41 4 £42,500 -24.11% 3
East of England +67 3 £32,500 -35.00% 2
North East +26 3 £58,000 +84.13% 6

MS Visio
Co-occurring Skills and Capabilities by Category

The follow tables expand on the table above by listing co-occurrences grouped by category. The same employment type, locality and period is covered with up to 20 co-occurrences shown in each of the following categories:

Application Platforms
1 42 (17.28%) SharePoint
2 22 (9.05%) Confluence
3 10 (4.12%) Oracle Service Bus
3 10 (4.12%) WebLogic
4 4 (1.65%) Apache Spark
5 1 (0.41%) Site Server
Applications
1 105 (43.21%) Microsoft Excel
2 77 (31.69%) Microsoft Office
3 76 (31.28%) Microsoft PowerPoint
4 48 (19.75%) Microsoft Project
5 4 (1.65%) Acrobat
5 4 (1.65%) InVision
5 4 (1.65%) Sketch
6 2 (0.82%) Adobe Creative Suite
6 2 (0.82%) Fireworks
6 2 (0.82%) Marvel
6 2 (0.82%) OmniGraffle
6 2 (0.82%) Photoshop
6 2 (0.82%) RoboHelp
Business Applications
1 12 (4.94%) Unit4 Business World
2 10 (4.12%) Remedy ITSM
3 6 (2.47%) Dynamics CRM
3 6 (2.47%) SAP MM
3 6 (2.47%) SAP S/4HANA
3 6 (2.47%) SAP SD
3 6 (2.47%) Sparx Enterprise Architect
4 2 (0.82%) Misys Midas
4 2 (0.82%) Primavera
4 2 (0.82%) SAP CO
4 2 (0.82%) SAP FI
4 2 (0.82%) SAP FI/CO
5 1 (0.41%) SAP Travel Management
Cloud Services
1 61 (25.10%) Azure
2 24 (9.88%) Microsoft 365
3 21 (8.64%) AWS
3 21 (8.64%) Power Platform
4 18 (7.41%) Dynamics 365
5 10 (4.12%) Azure DevOps
5 10 (4.12%) Lucidchart
6 8 (3.29%) Cloud Computing
7 7 (2.88%) IaaS
7 7 (2.88%) SaaS
8 6 (2.47%) Azure Data Factory
8 6 (2.47%) SuccessFactors
9 5 (2.06%) BrowserStack
9 5 (2.06%) Power Automate
10 4 (1.65%) Azure Cosmos DB
10 4 (1.65%) PaaS
10 4 (1.65%) Snowflake
11 3 (1.23%) Azure Monitor
11 3 (1.23%) Figma
11 3 (1.23%) Miro
Communications & Networking
1 15 (6.17%) BGP
1 15 (6.17%) Firewall
2 12 (4.94%) DHCP
2 12 (4.94%) DNS
2 12 (4.94%) Wi-Fi
2 12 (4.94%) Wireless
3 11 (4.53%) LAN
3 11 (4.53%) OSPF
3 11 (4.53%) TCP/IP
4 10 (4.12%) VoIP
4 10 (4.12%) WAN
5 9 (3.70%) VPN
6 8 (3.29%) MPLS
6 8 (3.29%) Unified Communications
7 7 (2.88%) SD-WAN
7 7 (2.88%) VLAN
8 6 (2.47%) Internet
8 6 (2.47%) Network Security
9 5 (2.06%) Cisco Nexus
10 4 (1.65%) 4G
Database & Business Intelligence
1 20 (8.23%) Power BI
2 11 (4.53%) SQL Server
3 10 (4.12%) Oracle Database
3 10 (4.12%) Oracle Database 10g
3 10 (4.12%) Oracle Database 11g
3 10 (4.12%) Tableau
3 10 (4.12%) VLDB
4 8 (3.29%) Data Warehouse
5 7 (2.88%) Big Data
6 6 (2.47%) Azure SQL Data Warehouse
6 6 (2.47%) Azure SQL Database
6 6 (2.47%) BusinessObjects
6 6 (2.47%) MS Access
7 5 (2.06%) Data Lake
8 4 (1.65%) SQL Server Reporting Services
9 3 (1.23%) Relational Database
10 2 (0.82%) PostgreSQL
10 2 (0.82%) QlikView
10 2 (0.82%) SQL Server Integration Services
10 2 (0.82%) SSDT
Development Applications
1 43 (17.70%) JIRA
2 7 (2.88%) Git
2 7 (2.88%) Visual Studio
3 5 (2.06%) NUnit
3 5 (2.06%) Selenium
3 5 (2.06%) SpecFlow
4 3 (1.23%) JMeter
4 3 (1.23%) Postman
5 2 (0.82%) Axure RP
5 2 (0.82%) Jenkins
5 2 (0.82%) Sonatype Nexus
5 2 (0.82%) SQL Server Management Studio (SSMS)
6 1 (0.41%) ERwin
6 1 (0.41%) Redmine
General
1 87 (35.80%) Social Skills
2 65 (26.75%) Analytical Skills
3 56 (23.05%) Finance
4 24 (9.88%) Public Sector
5 23 (9.47%) Presentation Skills
6 20 (8.23%) Marketing
6 20 (8.23%) Organisational Skills
7 13 (5.35%) Legal
7 13 (5.35%) Telecoms
8 10 (4.12%) Banking
9 9 (3.70%) Law
10 8 (3.29%) Inclusion and Diversity
10 8 (3.29%) Influencing Skills
10 8 (3.29%) Manufacturing
10 8 (3.29%) Retail
11 6 (2.47%) Documentation Skills
11 6 (2.47%) Electronics
11 6 (2.47%) Front Office
12 4 (1.65%) Financial Institution
12 4 (1.65%) Spanish Language
Job Titles
1 97 (39.92%) Analyst
2 74 (30.45%) Business Analyst
3 30 (12.35%) Project Manager
4 27 (11.11%) Senior
5 22 (9.05%) Lead
6 18 (7.41%) Network Engineer
7 16 (6.58%) Applications Support
8 11 (4.53%) Developer
8 11 (4.53%) Support Analyst
9 10 (4.12%) Applications Support Analyst
9 10 (4.12%) Architect
9 10 (4.12%) Consultant
9 10 (4.12%) Lead Business Analyst
9 10 (4.12%) Oracle Analyst
9 10 (4.12%) Oracle Support Analyst
9 10 (4.12%) Senior Analyst
9 10 (4.12%) SQL Analyst
9 10 (4.12%) SQL Support Analyst
10 9 (3.70%) IT Manager
10 9 (3.70%) Senior Business Analyst
Libraries, Frameworks & Software Standards
1 15 (6.17%) XML
2 9 (3.70%) JSON
3 6 (2.47%) .NET
3 6 (2.47%) SAP Fiori
4 5 (2.06%) .NET Core
4 5 (2.06%) .NET Framework
4 5 (2.06%) ASP.NET Web API
4 5 (2.06%) Entity Framework
4 5 (2.06%) HTML
4 5 (2.06%) WCF
5 4 (1.65%) EDI
5 4 (1.65%) Middleware
5 4 (1.65%) Spring
6 3 (1.23%) CSS
6 3 (1.23%) RESTful
7 2 (0.82%) 802.1X
7 2 (0.82%) Flash
7 2 (0.82%) J2EE
7 2 (0.82%) Sass
8 1 (0.41%) DHTML
Miscellaneous
1 30 (12.35%) Management Information System
2 16 (6.58%) Product Ownership
3 13 (5.35%) Data Centre
4 12 (4.94%) NHS
5 10 (4.12%) Self-Motivation
6 9 (3.70%) Data Structures
7 7 (2.88%) PMI
8 6 (2.47%) Analytical Mindset
8 6 (2.47%) Reference Data
9 5 (2.06%) Data Protection Act
9 5 (2.06%) Digital Media
10 4 (1.65%) Cyberattack
10 4 (1.65%) Distributed Computing
10 4 (1.65%) Legacy Applications
10 4 (1.65%) Public Cloud
11 3 (1.23%) Driving Licence
11 3 (1.23%) Legacy Systems
11 3 (1.23%) Onboarding
11 3 (1.23%) Video Conferencing
11 3 (1.23%) Virtual Team
Operating Systems
1 14 (5.76%) Linux
2 12 (4.94%) Unix
3 10 (4.12%) Solaris
4 4 (1.65%) Windows
5 3 (1.23%) Apple iOS
6 2 (0.82%) Android
7 1 (0.41%) Windows 10
7 1 (0.41%) Windows 7
Processes & Methodologies
1 86 (35.39%) Agile
2 55 (22.63%) Project Management
3 42 (17.28%) Scrum
4 41 (16.87%) Business Analysis
4 41 (16.87%) Project Delivery
5 37 (15.23%) Problem-Solving
6 36 (14.81%) Waterfall
7 32 (13.17%) Business Case
8 31 (12.76%) Stakeholder Management
8 31 (12.76%) User Stories
9 30 (12.35%) DevOps
10 28 (11.52%) Business Intelligence
11 27 (11.11%) Data Modelling
12 26 (10.70%) CRM
12 26 (10.70%) ERP
13 24 (9.88%) Decision-Making
14 23 (9.47%) PRINCE2
15 22 (9.05%) Roadmaps
16 21 (8.64%) Change Management
16 21 (8.64%) Workshop Facilitation
Programming Languages
1 58 (23.87%) SQL
2 16 (6.58%) Python
3 10 (4.12%) PL/SQL
4 8 (3.29%) PowerShell
5 6 (2.47%) C#
6 4 (1.65%) JavaScript
7 3 (1.23%) Java
7 3 (1.23%) R
8 2 (0.82%) T-SQL
9 1 (0.41%) VBA
Qualifications
1 94 (38.68%) Degree
2 18 (7.41%) Security Cleared
3 14 (5.76%) SC Cleared
4 13 (5.35%) Cisco Certification
5 9 (3.70%) PMI Certification
6 7 (2.88%) CCNA
6 7 (2.88%) IIBA
6 7 (2.88%) ISTQB
6 7 (2.88%) Master's Degree
7 6 (2.47%) ISEB
7 6 (2.47%) PMP
8 4 (1.65%) CCNP
8 4 (1.65%) Computer Science Degree
8 4 (1.65%) PRINCE2 Practitioner
8 4 (1.65%) Six Sigma Green Belt
9 3 (1.23%) CBAP
9 3 (1.23%) CCIE
9 3 (1.23%) CCIE Routing and Switching
10 2 (0.82%) Microsoft Certification
10 2 (0.82%) Network+ Certification
Quality Assurance & Compliance
1 20 (8.23%) PMO
1 20 (8.23%) QA
2 14 (5.76%) SLA
3 9 (3.70%) Data Quality
4 6 (2.47%) GRC
5 4 (1.65%) Actionable Recommendations
6 3 (1.23%) GDPR
6 3 (1.23%) ISO/IEC 27001
7 2 (0.82%) Cyber Essentials
8 1 (0.41%) COBIT
8 1 (0.41%) NIST
8 1 (0.41%) P3O
8 1 (0.41%) RMADS
System Software
1 10 (4.12%) Oracle RAC
2 6 (2.47%) Active Directory
3 4 (1.65%) VMware Infrastructure
4 2 (0.82%) vSphere
5 1 (0.41%) Docker
5 1 (0.41%) Virtual Machines
Systems Management
1 10 (4.12%) Data Guard
1 10 (4.12%) Oracle RMAN
2 6 (2.47%) HP ALM
3 5 (2.06%) FortiGate
4 4 (1.65%) Microsoft Intune
5 2 (0.82%) Nessus
5 2 (0.82%) Terraform
6 1 (0.41%) Ansible
6 1 (0.41%) Kubernetes
6 1 (0.41%) SCCM
Vendors
1 89 (36.63%) Microsoft
2 23 (9.47%) SAP
3 17 (7.00%) Cisco
3 17 (7.00%) Salesforce
4 14 (5.76%) Google
5 12 (4.94%) Civica
5 12 (4.94%) Northgate
5 12 (4.94%) Oracle
6 10 (4.12%) Remedy
6 10 (4.12%) Sun
7 9 (3.70%) Fortinet
8 8 (3.29%) Adobe
8 8 (3.29%) HP
8 8 (3.29%) Sparx
9 7 (2.88%) Palo Alto
10 6 (2.47%) Meraki
11 4 (1.65%) Databricks
11 4 (1.65%) OpenText
11 4 (1.65%) Siebel
11 4 (1.65%) VMware