Mobile Application
UK

The table below looks at the prevalence of the term Mobile App in permanent job vacancies. Included is a benchmarking guide to the salaries offered in vacancies that have cited Mobile App over the 6 months to 7 December 2023 with a comparison to the same period over the previous 2 years.

6 months to
7 Dec 2023
Same period 2022 Same period 2021
Rank 299 146 154
Rank change year-on-year -153 +8 -41
Permanent jobs citing Mobile App 558 3,012 3,247
As % of all permanent jobs advertised in the UK 1.05% 2.45% 2.53%
As % of the Miscellaneous category 2.86% 5.70% 5.76%
Number of salaries quoted 492 1,553 1,950
10th Percentile £35,000 £38,750 £37,500
25th Percentile £46,250 £47,500 £44,625
Median annual salary (50th Percentile) £60,000 £62,500 £60,000
Median % change year-on-year -4.00% +4.17% +9.09%
75th Percentile £82,500 £82,500 £77,500
90th Percentile £97,500 £102,500 £92,500
UK excluding London median annual salary £55,000 £55,000 £50,000
% change year-on-year - +10.00% +5.26%

All Generic Skills
UK

Mobile App is in the General and Transferable Skills category. The following table is for comparison with the above and provides summary statistics for all permanent job vacancies with a requirement for generic IT skills.

Permanent vacancies with a requirement for generic IT skills 19,511 52,884 56,385
As % of all permanent jobs advertised in the UK 36.83% 43.05% 44.00%
Number of salaries quoted 14,245 29,698 33,809
10th Percentile £33,000 £35,000 £33,750
25th Percentile £45,000 £46,250 £45,000
Median annual salary (50th Percentile) £62,500 £64,750 £60,000
Median % change year-on-year -3.47% +7.92% -
75th Percentile £83,750 £85,000 £82,500
90th Percentile £107,500 £106,000 £100,000
UK excluding London median annual salary £55,000 £55,000 £50,000
% change year-on-year - +10.00% -

Mobile App
Job Vacancy Trend

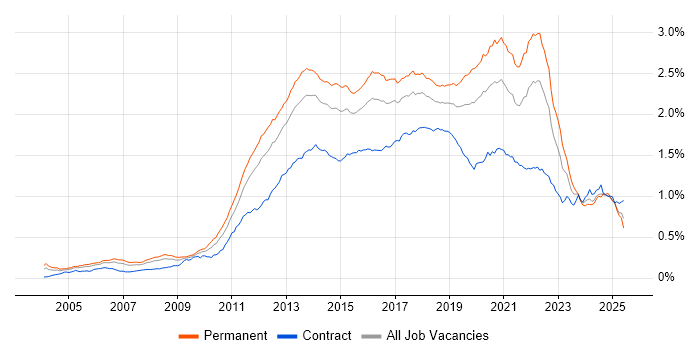
Job postings citing Mobile App as a proportion of all IT jobs advertised.

Job vacancy trend for Mobile App in the UK

Mobile App
Salary Trend

3-month moving average salary quoted in jobs citing Mobile App.

Salary trend for Mobile App in the UK

Mobile App
Salary Histogram

Salary distribution for jobs citing Mobile App over the 6 months to 7 December 2023.

Salary histogram for Mobile App in the UK

Mobile App
Top 16 Job Locations

The table below looks at the demand and provides a guide to the median salaries quoted in IT jobs citing Mobile App within the UK over the 6 months to 7 December 2023. The 'Rank Change' column provides an indication of the change in demand within each location based on the same 6 month period last year.

Location Rank Change
on Same Period
Last Year
Matching
Permanent
IT Job Ads
Median Salary
Past 6 Months
Median Salary
% Change
on Same Period
Last Year
Live
Jobs
England -143 491 £57,500 -8.00% 399
UK excluding London -120 283 £55,000 - 254
Work from Home -127 267 £60,000 -7.34% 247
London -129 215 £72,000 -0.69% 181
North of England -77 68 £55,000 - 77
Midlands +47 59 £52,500 -2.53% 37
South West -10 56 £52,500 +5.00% 24
South East -47 50 £52,500 -4.55% 73
North West -60 38 £51,500 +3.00% 37
West Midlands +96 35 £51,120 -5.09% 26
Yorkshire +26 27 £57,500 -11.54% 30
East of England +82 25 £60,000 +20.00% 27
East Midlands +3 23 £57,500 +9.52% 10
Scotland -71 20 £67,500 +12.50% 16
Wales -18 5 £55,000 +33.33% 4
North East +15 3 £55,000 -5.98% 10

Mobile App
Co-occurring Skills and Capabilities by Category

The follow tables expand on the table above by listing co-occurrences grouped by category. The same employment type, locality and period is covered with up to 20 co-occurrences shown in each of the following categories:

Application Platforms
1 21 (3.76%) Apache
2 20 (3.58%) SharePoint
3 19 (3.41%) Confluence
4 16 (2.87%) Apache Airflow
5 13 (2.33%) CMS
6 12 (2.15%) NServiceBus
7 8 (1.43%) OpenEdge
8 7 (1.25%) IIS
9 6 (1.08%) WordPress
10 4 (0.72%) ArcGIS
10 4 (0.72%) ArcSDE
11 2 (0.36%) SAS
12 1 (0.18%) Drupal
12 1 (0.18%) Headless CMS
12 1 (0.18%) Mendix
12 1 (0.18%) MS Exchange
Applications
1 8 (1.43%) Microsoft Office
2 7 (1.25%) Sketch
3 5 (0.90%) Adobe Creative Suite
4 4 (0.72%) Autodesk Inventor
4 4 (0.72%) Microsoft Excel
4 4 (0.72%) Photoshop
5 3 (0.54%) Chatbot
5 3 (0.54%) Microsoft PowerPoint
6 2 (0.36%) Acrobat
6 2 (0.36%) Adobe Illustrator
6 2 (0.36%) InDesign
6 2 (0.36%) Marvel
6 2 (0.36%) Spreadsheet
6 2 (0.36%) Zeplin
7 1 (0.18%) Blender
7 1 (0.18%) MS Visio
7 1 (0.18%) Trello
Business Applications
1 2 (0.36%) Payment Gateway
1 2 (0.36%) SAP ERP
1 2 (0.36%) SAP S/4HANA
2 1 (0.18%) Elite 3E
Cloud Services
1 106 (19.00%) AWS
2 88 (15.77%) Azure
3 47 (8.42%) Serverless
4 40 (7.17%) Figma
5 36 (6.45%) Azure DevOps
6 35 (6.27%) GCP
6 35 (6.27%) GitHub
7 30 (5.38%) SaaS
8 21 (3.76%) npm
8 21 (3.76%) Power Platform
9 20 (3.58%) AWS Lambda
10 19 (3.41%) Bitrise
10 19 (3.41%) PaaS
11 18 (3.23%) IaaS
12 17 (3.05%) Cloud Computing
12 17 (3.05%) Google Play
13 14 (2.51%) Azure Monitor
14 13 (2.33%) Amazon CloudWatch
14 13 (2.33%) Amazon Cognito
15 12 (2.15%) CloudFront
Communications & Networking
1 10 (1.79%) Firewall
2 8 (1.43%) TCP/IP
3 4 (0.72%) DNS
3 4 (0.72%) HTTP
3 4 (0.72%) Internet
3 4 (0.72%) Network Security
3 4 (0.72%) SSH
4 3 (0.54%) DHCP
4 3 (0.54%) HTTPS
4 3 (0.54%) Wireless
4 3 (0.54%) Wireless Security
5 2 (0.36%) Multicast
5 2 (0.36%) VPN
6 1 (0.18%) Intranet
6 1 (0.18%) IPsec
Database & Business Intelligence
1 43 (7.71%) SQL Server
2 18 (3.23%) PostgreSQL
3 16 (2.87%) Apache Ignite
3 16 (2.87%) Power BI
3 16 (2.87%) Relational Database
4 13 (2.33%) MySQL
5 12 (2.15%) DynamoDB
6 11 (1.97%) Event Store
6 11 (1.97%) SQL Server Reporting Services
7 10 (1.79%) MongoDB
7 10 (1.79%) RavenDB
8 8 (1.43%) BigQuery
8 8 (1.43%) RDBMS
8 8 (1.43%) SQLite
9 7 (1.25%) Azure SQL Database
10 6 (1.08%) Elasticsearch
10 6 (1.08%) NoSQL
11 5 (0.90%) Crystal Reports
11 5 (0.90%) Data Lake
11 5 (0.90%) SQL Server Integration Services
Development Applications
1 71 (12.72%) Git
2 41 (7.35%) JIRA
3 25 (4.48%) Jenkins
4 19 (3.41%) Cypress.io
4 19 (3.41%) TeamCity
5 17 (3.05%) Visual Studio
6 16 (2.87%) Android Studio
6 16 (2.87%) GitLab
6 16 (2.87%) Octopus Deploy
7 14 (2.51%) Xcode
8 13 (2.33%) Selenium
8 13 (2.33%) SpecFlow
9 10 (1.79%) fastlane
9 10 (1.79%) Mercurial
10 9 (1.61%) Appium
10 9 (1.61%) Team Foundation Server
11 8 (1.43%) CircleCI
12 7 (1.25%) Bitbucket
13 6 (1.08%) git-flow
14 5 (0.90%) Burp Suite
General
1 191 (34.23%) Social Skills
2 125 (22.40%) Finance
3 34 (6.09%) Banking
4 30 (5.38%) Retail
5 27 (4.84%) Analytical Skills
6 24 (4.30%) Marketing
7 18 (3.23%) Front Office
8 17 (3.05%) Manufacturing
9 14 (2.51%) Games
9 14 (2.51%) Law
10 11 (1.97%) Automotive
10 11 (1.97%) Tech for Good
11 10 (1.79%) Legal
12 8 (1.43%) Documentation Skills
12 8 (1.43%) Music Industry
13 7 (1.25%) Organisational Skills
14 6 (1.08%) Presentation Skills
14 6 (1.08%) Public Sector
14 6 (1.08%) Publishing
14 6 (1.08%) Telecoms
Job Titles
1 196 (35.13%) Developer
2 124 (22.22%) Senior
3 61 (10.93%) Lead
4 45 (8.06%) Analyst
4 45 (8.06%) Software Engineer
5 44 (7.89%) React Developer
6 41 (7.35%) Senior Developer
7 34 (6.09%) Applications Developer
8 32 (5.73%) Designer
9 31 (5.56%) Tester
10 29 (5.20%) Mobile Developer
11 28 (5.02%) .NET Developer
12 23 (4.12%) Software Developer
13 22 (3.94%) Architect
13 22 (3.94%) DevOps Engineer
13 22 (3.94%) Front-End Engineer (Client-Side Engineer)
14 21 (3.76%) Mobile Applications Developer
15 20 (3.58%) UX Designer
16 19 (3.41%) C# Developer
16 19 (3.41%) Senior Designer
Libraries, Frameworks & Software Standards
1 108 (19.35%) .NET
2 105 (18.82%) React
3 84 (15.05%) RESTful
4 82 (14.70%) HTML
5 74 (13.26%) CSS
6 70 (12.54%) React Native
7 53 (9.50%) AngularJS
8 47 (8.42%) Node.js
9 40 (7.17%) Web Services
10 39 (6.99%) Redux
11 32 (5.73%) Flutter
11 32 (5.73%) REST
11 32 (5.73%) Vue
12 31 (5.56%) Ionic Framework
13 28 (5.02%) GraphQL
14 27 (4.84%) HTML5
15 26 (4.66%) ASP.NET
16 24 (4.30%) .NET Core
16 24 (4.30%) .NET Framework
16 24 (4.30%) Sass
Miscellaneous
1 31 (5.56%) Product Ownership
2 30 (5.38%) Greenfield Project
3 23 (4.12%) Cloud Native
4 18 (3.23%) Equities
4 18 (3.23%) Fixed Income
5 17 (3.05%) Blog
6 15 (2.69%) IoT
7 12 (2.15%) Virtual Team
8 11 (1.97%) Self-Motivation
9 9 (1.61%) Algorithms
9 9 (1.61%) Data Protection Act
9 9 (1.61%) Management Information System
10 8 (1.43%) Client/Server
10 8 (1.43%) e-Learning
11 7 (1.25%) Embedded Systems
11 7 (1.25%) Enterprise Software
11 7 (1.25%) Onboarding
11 7 (1.25%) Public Cloud
12 5 (0.90%) Augmented Reality
12 5 (0.90%) iPhone
Operating Systems
1 120 (21.51%) Android
2 107 (19.18%) Apple iOS
3 31 (5.56%) Windows
4 25 (4.48%) Linux
5 13 (2.33%) VMS
6 8 (1.43%) Windows Server
7 7 (1.25%) Embedded Linux
8 5 (0.90%) Ubuntu
9 4 (0.72%) Kali Linux
9 4 (0.72%) Unix
10 2 (0.36%) Mac OS X
10 2 (0.36%) Windows 10
10 2 (0.36%) Windows Server 2012
10 2 (0.36%) Windows Server 2016
11 1 (0.18%) Debian
Processes & Methodologies
1 222 (39.78%) Agile
2 121 (21.68%) User Experience
3 108 (19.35%) Software Engineering
4 84 (15.05%) Mentoring
5 83 (14.87%) UX Design
6 80 (14.34%) Problem-Solving
7 79 (14.16%) CI/CD
8 77 (13.80%) DevOps
9 76 (13.62%) Scrum
10 75 (13.44%) Mobile Application Development
11 63 (11.29%) Computer Science
11 63 (11.29%) Test Automation
12 54 (9.68%) SDLC
13 49 (8.78%) Roadmaps
14 46 (8.24%) Microservices
15 43 (7.71%) Continuous Integration
15 43 (7.71%) Full Stack Development
16 42 (7.53%) Design Patterns
17 41 (7.35%) Unit Testing
18 40 (7.17%) MVC
Programming Languages
1 189 (33.87%) JavaScript
2 106 (19.00%) C#
3 93 (16.67%) SQL
4 68 (12.19%) Python
5 61 (10.93%) TypeScript
6 51 (9.14%) Java
7 24 (4.30%) Kotlin
8 23 (4.12%) C++
8 23 (4.12%) PowerShell
9 20 (3.58%) PHP
10 19 (3.41%) Bash
11 18 (3.23%) Go
11 18 (3.23%) Swift
12 12 (2.15%) Ruby
13 8 (1.43%) Dart
13 8 (1.43%) Objective-C
13 8 (1.43%) OpenEdge ABL
13 8 (1.43%) Progress 4GL
14 7 (1.25%) C
15 6 (1.08%) T-SQL
Qualifications
1 102 (18.28%) Degree
2 35 (6.27%) Computer Science Degree
3 28 (5.02%) Security Cleared
4 12 (2.15%) BPSS Clearance
5 9 (1.61%) SC Cleared
6 7 (1.25%) Microsoft Certification
7 6 (1.08%) CREST Certified
7 6 (1.08%) OSCP
8 5 (0.90%) CHECK Team Member
9 4 (0.72%) DV Cleared
10 3 (0.54%) CHECK Team Leader
10 3 (0.54%) ISTQB
10 3 (0.54%) ISTQB Foundation Certification
10 3 (0.54%) Master's Degree
10 3 (0.54%) Numerate Degree
10 3 (0.54%) Tableau Certification
11 2 (0.36%) A+ Certification
11 2 (0.36%) Azure Certification
11 2 (0.36%) ISEB
11 2 (0.36%) SANS
Quality Assurance & Compliance
1 46 (8.24%) QA
2 21 (3.76%) Accessibility
3 10 (1.79%) ISO/IEC 27001
4 6 (1.08%) NIST
5 5 (0.90%) GDPR
5 5 (0.90%) SLA
6 2 (0.36%) ISO 9001
7 1 (0.18%) Actionable Recommendations
7 1 (0.18%) PCI DSS
7 1 (0.18%) PSD2
7 1 (0.18%) SOC 2
System Software
1 44 (7.89%) Docker
2 13 (2.33%) Virtual Machines
3 9 (1.61%) Active Directory
4 5 (0.90%) Firmware
5 1 (0.18%) Embedded Firmware
5 1 (0.18%) Hyper-V
5 1 (0.18%) VMware Infrastructure
Systems Management
1 37 (6.63%) Kubernetes
2 29 (5.20%) Terraform
3 8 (1.43%) Ansible
4 3 (0.54%) Microsoft Intune
4 3 (0.54%) Nmap
4 3 (0.54%) SCCM
5 2 (0.36%) Nessus
6 1 (0.18%) Active Directory Federation Services
6 1 (0.18%) AirWatch
6 1 (0.18%) CSIRT
6 1 (0.18%) EnCase
6 1 (0.18%) FTK
6 1 (0.18%) Grafana
6 1 (0.18%) Progress Chef
6 1 (0.18%) Prometheus
Vendors
1 49 (8.78%) Microsoft
2 47 (8.42%) Google
3 24 (4.30%) Xamarin
4 20 (3.58%) Apple
5 9 (1.61%) Adobe
6 8 (1.43%) Progress
7 7 (1.25%) SAP
8 5 (0.90%) Salesforce
9 4 (0.72%) Autodesk
9 4 (0.72%) ESRI
9 4 (0.72%) iManage
9 4 (0.72%) Intapp
9 4 (0.72%) New Relic
10 3 (0.54%) Facebook
10 3 (0.54%) mParticle
10 3 (0.54%) Tealium
11 2 (0.36%) Hotjar
11 2 (0.36%) Splunk
11 2 (0.36%) SYSPRO
11 2 (0.36%) VMware