Microsoft PowerPoint Job Trends

Microsoft PowerPoint
UK

The table below provides summary statistics and salary benchmarking for jobs requiring Microsoft PowerPoint skills. It covers permanent job vacancies from the 6 months leading up to 23 November 2025, with comparisons to the same periods in the previous two years.

6 months to
23 Nov 2025
Same period 2024 Same period 2023
Rank 239 225 236
Rank change year-on-year -14 +11 +14
Permanent jobs citing Microsoft PowerPoint 551 822 747
As % of all permanent jobs in the UK 1.04% 1.20% 1.44%
As % of the Applications category 8.38% 12.97% 16.90%
Number of salaries quoted 280 249 408
10th Percentile £26,250 £30,000 £26,250
25th Percentile £32,000 £38,000 £31,250
Median annual salary (50th Percentile) £45,000 £50,000 £44,500
Median % change year-on-year -10.00% +12.36% -11.00%
75th Percentile £61,563 £60,000 £60,000
90th Percentile £80,000 £74,000 £73,750
UK excluding London median annual salary £41,075 £47,500 £38,750
% change year-on-year -13.53% +22.58% -10.92%

All Software Application Skills
UK

Microsoft PowerPoint falls under the Software Applications category. For comparison with the information above, the following table provides summary statistics for all permanent job vacancies requiring software application skills.

Permanent vacancies with a requirement for software application skills 6,573 6,338 4,421
As % of all permanent jobs advertised in the UK 12.37% 9.22% 8.50%
Number of salaries quoted 2,627 2,303 3,094
10th Percentile £26,250 £27,750 £25,000
25th Percentile £31,000 £35,000 £30,500
Median annual salary (50th Percentile) £40,000 £47,500 £45,000
Median % change year-on-year -15.79% +5.56% -2.17%
75th Percentile £57,500 £62,500 £61,250
90th Percentile £73,750 £80,000 £73,750
UK excluding London median annual salary £37,750 £43,058 £38,000
% change year-on-year -12.33% +13.31% -2.56%

Microsoft PowerPoint
Job Vacancy Trend

Historical trend showing the proportion of permanent IT job postings citing Microsoft PowerPoint relative to all permanent IT jobs advertised.
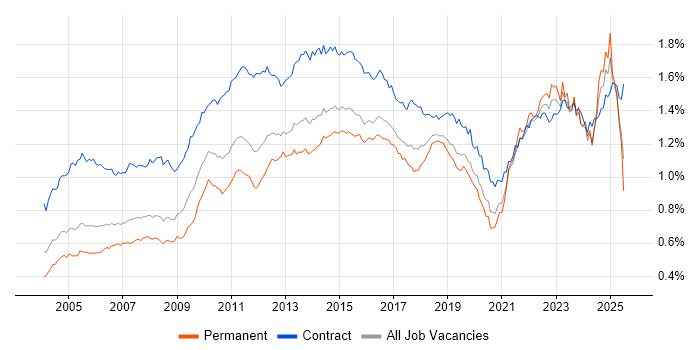
Microsoft PowerPoint job vacancy trend in the UK

Microsoft PowerPoint
Salary Trend

Salary distribution trend for jobs in the UK citing Microsoft PowerPoint.

Salary distribution trend for jobs in the UK citing Microsoft PowerPoint

Microsoft PowerPoint
Salary Histogram

Salary distribution for jobs citing Microsoft PowerPoint over the 6 months to 23 November 2025.

Salary histogram for Microsoft PowerPoint in the UK

Microsoft PowerPoint
Top 17 Job Locations

The table below looks at the demand and provides a guide to the median salaries quoted in IT jobs citing Microsoft PowerPoint within the UK over the 6 months to 23 November 2025. The 'Rank Change' column provides an indication of the change in demand within each location based on the same 6 month period last year.

Location Rank Change
on Same Period
Last Year
Matching
Permanent
IT Job Ads
Median Salary
Past 6 Months
Median Salary
% Change
on Same Period
Last Year
Live
Jobs
England -57 420 £45,000 -10.00% 273
UK excluding London -31 303 £41,075 -13.53% 218
London +29 196 £50,000 - 99
Work from Home +82 154 £47,500 -5.00% 139
South East -18 76 £37,750 -16.11% 97
Scotland +60 74 £57,500 -0.92% 6
North of England -46 57 £45,000 +5.88% 32
North West -37 37 £33,000 -22.35% 17
East of England +4 33 £37,500 -12.28% 22
Midlands -35 31 £41,500 -17.00% 25
South West +23 26 £37,250 -35.22% 28
West Midlands +10 17 £34,500 -25.41% 15
East Midlands -29 14 £41,500 -17.00% 10
Yorkshire +8 13 £56,250 +53.06% 10
North East +21 7 £50,000 +5.26% 5
Northern Ireland +6 7 £57,500 +43.75% 13
Wales +11 1 - - 4

Microsoft PowerPoint
Co-Occurring Skills & Capabilities by Category

The following tables expand on the one above by listing co-occurrences grouped by category. They cover the same employment type, locality and period, with up to 20 co-occurrences shown in each category:

Application Platforms
1 113 (20.51%) SharePoint
2 17 (3.09%) Confluence
3 12 (2.18%) Microsoft Exchange
4 11 (2.00%) Skype for Business
5 7 (1.27%) WordPress
6 4 (0.73%) CMS
7 3 (0.54%) ArcGIS
8 2 (0.36%) SAS
9 1 (0.18%) IIS
9 1 (0.18%) Moodle
Applications
1 508 (92.20%) Microsoft Excel
2 308 (55.90%) Microsoft Office
3 38 (6.90%) MS Visio
4 25 (4.54%) Microsoft Project
5 24 (4.36%) Photoshop
6 23 (4.17%) InDesign
7 19 (3.45%) Spreadsheet
8 14 (2.54%) Adobe Creative Suite
8 14 (2.54%) Adobe Illustrator
9 11 (2.00%) Adobe Premiere
10 4 (0.73%) Trello
11 2 (0.36%) Adobe After Effects
11 2 (0.36%) AutoCAD
11 2 (0.36%) SPSS
12 1 (0.18%) Acrobat
12 1 (0.18%) Chatbot
12 1 (0.18%) SOLIDWORKS
Business Applications
1 11 (2.00%) Dynamics CRM
2 10 (1.81%) SAP S/4HANA
3 3 (0.54%) Oracle Payables
3 3 (0.54%) Yoast SEO
4 2 (0.36%) iTrent
4 2 (0.36%) Maximo
4 2 (0.36%) Oracle Cash Management
4 2 (0.36%) Relativity
4 2 (0.36%) Towers Watson Igloo
5 1 (0.18%) CA PPM
5 1 (0.18%) Dynamics NAV
5 1 (0.18%) Elite 3E
5 1 (0.18%) NetSuite
5 1 (0.18%) Oracle Financials
5 1 (0.18%) Oracle Procure-to-Pay
5 1 (0.18%) Oracle Receivables
5 1 (0.18%) Salesforce CRM
Cloud Services
1 69 (12.52%) Microsoft 365
2 60 (10.89%) Power Platform
3 27 (4.90%) Azure
4 21 (3.81%) OneDrive
5 20 (3.63%) SaaS
6 14 (2.54%) Dynamics 365
7 8 (1.45%) AWS
7 8 (1.45%) Canva
8 7 (1.27%) Azure DevOps
8 7 (1.27%) Smartsheet
9 6 (1.09%) Entra ID
9 6 (1.09%) Figma
10 5 (0.91%) Google Workspace
10 5 (0.91%) Microsoft Copilot
11 4 (0.73%) Asana
11 4 (0.73%) GCP
11 4 (0.73%) Miro
11 4 (0.73%) Slack
12 3 (0.54%) Amazon Ads
12 3 (0.54%) PowerApps
Communications & Networking
1 20 (3.63%) Unified Communications
2 18 (3.27%) Wireless
3 15 (2.72%) WebEx
4 11 (2.00%) Skype
5 10 (1.81%) DHCP
6 9 (1.63%) DNS
6 9 (1.63%) LAN
7 8 (1.45%) Firewall
7 8 (1.45%) TCP/IP
8 7 (1.27%) Internet
8 7 (1.27%) Wi-Fi
9 5 (0.91%) MPLS
9 5 (0.91%) WAN
9 5 (0.91%) WLAN
10 4 (0.73%) Broadband
10 4 (0.73%) Intranet
11 3 (0.54%) Cisco Wireless
12 2 (0.36%) Fibre Channel
12 2 (0.36%) SAN
12 2 (0.36%) SD-WAN
Database & Business Intelligence
1 54 (9.80%) Power BI
2 15 (2.72%) Tableau
3 11 (2.00%) BusinessObjects
4 7 (1.27%) SQL Server
5 6 (1.09%) Data Mining
5 6 (1.09%) DB2
5 6 (1.09%) PostgreSQL
6 4 (0.73%) Data Warehouse
7 3 (0.54%) GIS
7 3 (0.54%) Power Query
7 3 (0.54%) SAP HANA
7 3 (0.54%) SQL Server Reporting Services
8 2 (0.36%) Big Data
8 2 (0.36%) EDRMS
8 2 (0.36%) Looker
8 2 (0.36%) Oracle Database
8 2 (0.36%) Relational Database
9 1 (0.18%) MS Access
9 1 (0.18%) Oracle Reports
9 1 (0.18%) Spotfire
Development Applications
1 39 (7.08%) JIRA
2 6 (1.09%) Bitbucket
2 6 (1.09%) Cucumber
2 6 (1.09%) Jenkins
2 6 (1.09%) Selenium
2 6 (1.09%) TeamCity
3 1 (0.18%) ClearCase
3 1 (0.18%) SQL Server Management Studio (SSMS)
General
1 318 (57.71%) Social Skills
2 187 (33.94%) Finance
3 142 (25.77%) Analytical Skills
4 102 (18.51%) Marketing
5 65 (11.80%) Organisational Skills
6 50 (9.07%) Law
7 48 (8.71%) Presentation Skills
8 44 (7.99%) Legal
9 36 (6.53%) Retail
10 32 (5.81%) Telecoms
11 29 (5.26%) Advertising
12 26 (4.72%) Banking
13 21 (3.81%) Inclusion and Diversity
14 17 (3.09%) German Language
15 15 (2.72%) Manufacturing
16 13 (2.36%) Dutch Language
16 13 (2.36%) French Language
17 12 (2.18%) Influencing Skills
18 11 (2.00%) Public Sector
18 11 (2.00%) Spanish Language
Job Titles
1 111 (20.15%) Senior
2 93 (16.88%) Analyst
3 83 (15.06%) Senior Manager
4 64 (11.62%) QA Manager
4 64 (11.62%) Quality Manager
4 64 (11.62%) Senior QA Manager
4 64 (11.62%) Senior Quality Manager
5 47 (8.53%) Support Analyst
6 40 (7.26%) IT Support
7 34 (6.17%) Project Manager
8 28 (5.08%) IT Analyst
9 27 (4.90%) Coordinator
9 27 (4.90%) IT Support Analyst
10 24 (4.36%) Account Manager
11 22 (3.99%) Lead
12 18 (3.27%) Support Specialist
13 17 (3.09%) Technical Analyst
13 17 (3.09%) Technical Support
14 16 (2.90%) Business Analyst
14 16 (2.90%) Technical Support Analyst
Libraries, Frameworks & Software Standards
1 10 (1.81%) CSS
1 10 (1.81%) HTML
2 6 (1.09%) Elastic Stack
2 6 (1.09%) Gherkin
2 6 (1.09%) Node.js
2 6 (1.09%) React
2 6 (1.09%) RESTful
3 3 (0.54%) EDI
3 3 (0.54%) Oracle Fusion
4 2 (0.36%) Unity (Game Engine)
4 2 (0.36%) Unreal Engine
5 1 (0.18%) EJB
5 1 (0.18%) Express.js
5 1 (0.18%) JSON
5 1 (0.18%) MFC
5 1 (0.18%) WSH
5 1 (0.18%) XML
Miscellaneous
1 70 (12.70%) Onboarding
2 43 (7.80%) Self-Motivation
3 35 (6.35%) Social Media
4 31 (5.63%) Management Information System
5 28 (5.08%) Video Conferencing
6 26 (4.72%) Analytical Mindset
7 16 (2.90%) Digital Media
8 14 (2.54%) Driving Licence
9 13 (2.36%) Web Conferencing
10 11 (2.00%) Motion Graphics
11 10 (1.81%) e-Learning
11 10 (1.81%) Wiki
12 9 (1.63%) Data Structures
12 9 (1.63%) Graphic Design
13 8 (1.45%) Team-Oriented Environment
14 6 (1.09%) Animation
14 6 (1.09%) Greenfield Project
14 6 (1.09%) Product Ownership
15 5 (0.91%) Life Science
15 5 (0.91%) Virtual Team
Operating Systems
1 50 (9.07%) Windows
2 12 (2.18%) Windows 10
3 6 (1.09%) Apple iOS
4 4 (0.73%) Mac OS
4 4 (0.73%) Windows Server
5 2 (0.36%) Linux
5 2 (0.36%) Windows Server 2012
5 2 (0.36%) Windows Server 2016
6 1 (0.18%) Windows Server 2008
Processes & Methodologies
1 184 (33.39%) Project Management
2 138 (25.05%) Problem-Solving
3 130 (23.59%) Continuous Improvement
4 103 (18.69%) Coaching
5 91 (16.52%) Agile
6 88 (15.97%) Business Intelligence
7 86 (15.61%) Customer Experience
8 74 (13.43%) Quality Management
9 70 (12.70%) Project Delivery
10 65 (11.80%) Decision-Making
10 65 (11.80%) Due Diligence
10 65 (11.80%) Six Sigma
11 64 (11.62%) Lean Six Sigma
11 64 (11.62%) Performance Improvement
12 58 (10.53%) Data Analysis
13 56 (10.16%) Analytics
14 53 (9.62%) ITIL
15 48 (8.71%) Stakeholder Management
16 45 (8.17%) CRM
17 44 (7.99%) Service Delivery
Programming Languages
1 29 (5.26%) SQL
2 8 (1.45%) VBA
3 7 (1.27%) Java
3 7 (1.27%) Python
4 6 (1.09%) JavaScript
4 6 (1.09%) PowerShell
5 3 (0.54%) R
6 1 (0.18%) C
6 1 (0.18%) PL/SQL
6 1 (0.18%) RPG
6 1 (0.18%) Shell Script
6 1 (0.18%) VBScript
Qualifications
1 166 (30.13%) Degree
2 64 (11.62%) Six Sigma Yellow Belt
3 27 (4.90%) Master's Degree
4 24 (4.36%) PMI Certification
5 21 (3.81%) PMP
6 16 (2.90%) Security Cleared
7 13 (2.36%) A+ Certification
7 13 (2.36%) DBS Check
8 10 (1.81%) SC Cleared
9 9 (1.63%) MBA
10 8 (1.45%) ACCA
11 7 (1.27%) CIMA
12 5 (0.91%) CCNP
12 5 (0.91%) CFA
12 5 (0.91%) Cisco Certification
12 5 (0.91%) HNC
12 5 (0.91%) MCP
13 4 (0.73%) HND
13 4 (0.73%) PRINCE2 Certification
14 3 (0.54%) CISSP
Quality Assurance & Compliance
1 84 (15.25%) QA
2 47 (8.53%) PMO
3 28 (5.08%) ISO/IEC 27001
4 20 (3.63%) ISO 9001
5 14 (2.54%) Data Quality
6 10 (1.81%) GDPR
7 6 (1.09%) Cyber Essentials
8 5 (0.91%) SLA
9 4 (0.73%) Accessibility
9 4 (0.73%) MiFID
9 4 (0.73%) NIST
10 2 (0.36%) GRC
10 2 (0.36%) ISO 14001
10 2 (0.36%) ISO 20022
10 2 (0.36%) NIST 800
10 2 (0.36%) P3O
10 2 (0.36%) Sarbanes-Oxley
11 1 (0.18%) COBIT
11 1 (0.18%) EMIR
11 1 (0.18%) PMBOK
System Software
1 27 (4.90%) Active Directory
2 6 (1.09%) Docker
3 3 (0.54%) VMware Infrastructure
4 2 (0.36%) Hyper-V
5 1 (0.18%) Virtual Desktop
5 1 (0.18%) VMware ESXi
Systems Management
1 18 (3.27%) Microsoft Intune
2 6 (1.09%) Kubernetes
3 3 (0.54%) Computer Emergency Response Teams
3 3 (0.54%) Single Sign-On
3 3 (0.54%) Systems Management Server (SMS)
4 2 (0.36%) Ansible
4 2 (0.36%) FortiGate
4 2 (0.36%) RSA Archer
5 1 (0.18%) Backup Exec
5 1 (0.18%) SCCM
Vendors
1 371 (67.33%) Microsoft
2 38 (6.90%) Adobe
3 20 (3.63%) Cisco
4 16 (2.90%) Atlassian
4 16 (2.90%) SAP
5 15 (2.72%) ServiceNow
6 12 (2.18%) Salesforce
7 11 (2.00%) Google
7 11 (2.00%) Polycom
8 9 (1.63%) Zoho
9 8 (1.45%) Facebook
9 8 (1.45%) HubSpot
10 7 (1.27%) Oracle
10 7 (1.27%) VMware
11 6 (1.09%) Apple
11 6 (1.09%) Workday
12 5 (0.91%) Fortinet
12 5 (0.91%) GoldenSource
13 4 (0.73%) IFS
13 4 (0.73%) YouTube