Front Office Contracts in England

Front Office
UK > England

The table below looks at the prevalence of the term Front Office in contract job vacancies in England. Included is a benchmarking guide to the contractor rates offered in vacancies that cited Front Office over the 6 months leading up to 28 August 2025, comparing them to the same period in the previous two years.

6 months to
28 Aug 2025
Same period 2024 Same period 2023
Rank 125 85 86
Rank change year-on-year -40 +1 0
DemandTrendContract jobs citing Front Office 619 867 1,148
As % of all contract jobs advertised in England 2.25% 2.61% 2.65%
As % of the General category 3.49% 4.54% 4.46%
Number of daily rates quoted 515 760 996
10th Percentile £525 £538 £488
25th Percentile £631 £644 £574
Median daily rate (50th Percentile) £750 £750 £700
Median % change year-on-year - +7.14% -
75th Percentile £850 £863 £823
90th Percentile £875 £888 £888
UK median daily rate £738 £750 £700
% change year-on-year -1.57% +7.14% -
Number of hourly rates quoted 3 0 0
10th Percentile - - -
25th Percentile - - -
Median hourly rate £16.36 - -
75th Percentile £18.90 - -
90th Percentile £20.42 - -
UK median hourly rate £16.36 - -

All General Skills
England

Front Office falls under the General Skills category. For comparison with the information above, the following table provides summary statistics for all contract job vacancies requiring common skills in England.

DemandTrendContract vacancies with a requirement for common skills 17,743 19,107 25,720
As % of all contract IT jobs advertised in England 64.39% 57.59% 59.31%
Number of daily rates quoted 11,277 12,084 17,895
10th Percentile £275 £300 £313
25th Percentile £400 £417 £450
Median daily rate (50th Percentile) £501 £538 £550
Median % change year-on-year -6.88% -2.27% -
75th Percentile £638 £651 £675
90th Percentile £750 £775 £788
UK median daily rate £500 £525 £550
% change year-on-year -4.76% -4.55% -
Number of hourly rates quoted 985 1,107 962
10th Percentile £13.50 £14.06 £14.25
25th Percentile £16.30 £17.47 £16.85
Median hourly rate £25.15 £38.12 £28.58
Median % change year-on-year -34.02% +33.38% +16.46%
75th Percentile £50.00 £61.30 £60.00
90th Percentile £72.80 £71.25 £73.75
UK median hourly rate £25.15 £35.00 £27.50
% change year-on-year -28.14% +27.27% +12.61%

Front Office
Job Vacancy Trend in England

Job postings citing Front Office as a proportion of all IT jobs advertised in England.
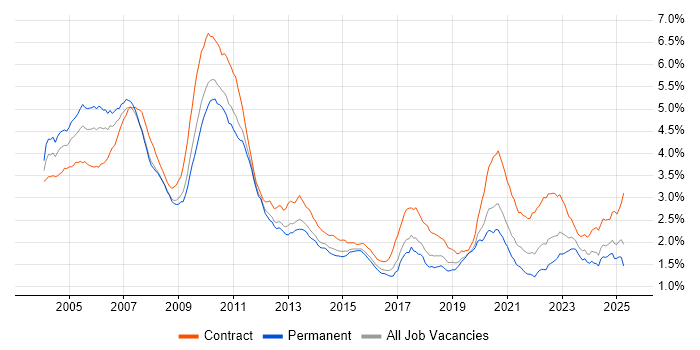
Job vacancy trend for Front Office in England

Front Office
Daily Rate Trend in England

Contractor daily rate distribution trend for jobs in England citing Front Office.

Contractor daily rate distribution trend for jobs in England citing Front Office

Front Office
Daily Rate Histogram in England

Daily rate distribution for jobs citing Front Office in England over the 6 months to 28 August 2025.

Daily rate histogram for Front Office in England

Front Office
Hourly Rate Trend in England

Contractor hourly rate distribution trend for jobs in England citing Front Office.

Contractor hourly rate distribution trend for jobs in England citing Front Office

Front Office
DemandTrendContract Job Locations in England

The table below looks at the demand and provides a guide to the median contractor rates quoted in IT jobs citing Front Office within the England region over the 6 months to 28 August 2025. The 'Rank Change' column provides an indication of the change in demand within each location based on the same 6 month period last year.

Location Rank Change
on Same Period
Last Year
Matching
DemandTrendContract
IT Job Ads
Median
Daily Rate
Past 6 Months
Median Daily Rate
% Change
on Same Period
Last Year
Live
Jobs
London -14 600 £750 - 140
South East +10 6 £447 - 88
East of England - 3 £400 -
Yorkshire -10 2 £613 -5.77%
North of England -30 2 £613 +51.23% 3
East Midlands -4 1 £437 +22.75% 1
Midlands -11 1 £437 +22.75% 1
Front Office
UK

Front Office
Co-occurring Skills and Capabilities in England by Category

The follow tables expand on the table above by listing co-occurrences grouped by category. The same employment type, locality and period is covered with up to 20 co-occurrences shown in each of the following categories:

Application Platforms
1 85 (13.73%) Apache Airflow
2 53 (8.56%) Apache
3 21 (3.39%) Confluence
4 6 (0.97%) SharePoint
5 4 (0.65%) Apache Spark
6 3 (0.48%) CMS
7 1 (0.16%) Appian
7 1 (0.16%) IBM HTTP Server
7 1 (0.16%) Microsoft Exchange
7 1 (0.16%) MQSeries
7 1 (0.16%) Tomcat
Applications
1 29 (4.68%) Microsoft Excel
2 11 (1.78%) Microsoft PowerPoint
3 6 (0.97%) Microsoft Office
4 4 (0.65%) Microsoft Project
5 3 (0.48%) Spreadsheet
6 1 (0.16%) Notion
6 1 (0.16%) Sketch
6 1 (0.16%) Trello
6 1 (0.16%) Zeplin
Business Applications
1 44 (7.11%) Aladdin
2 22 (3.55%) thinkFolio
3 9 (1.45%) Endur
4 7 (1.13%) Fidessa
5 6 (0.97%) ION Anvil
6 3 (0.48%) Bankmaster
7 2 (0.32%) BondVision
7 2 (0.32%) Eagle PACE
7 2 (0.32%) ION MarketView
7 2 (0.32%) Markit EDM
8 1 (0.16%) Actimize
8 1 (0.16%) Eikon
8 1 (0.16%) Eze OMS
8 1 (0.16%) Loan IQ
8 1 (0.16%) OpenLink RightAngle
8 1 (0.16%) Orchestrade
8 1 (0.16%) PORTIA
8 1 (0.16%) SAP Oil and Gas
Cloud Services
1 178 (28.76%) AWS
2 90 (14.54%) GCP
3 85 (13.73%) dbt
4 67 (10.82%) Azure
5 53 (8.56%) Snowflake
6 17 (2.75%) Power Platform
7 14 (2.26%) Amazon S3
8 10 (1.62%) GitHub
9 9 (1.45%) Azure DevOps
9 9 (1.45%) Microsoft 365
10 7 (1.13%) Figma
11 5 (0.81%) Azure Cosmos DB
12 4 (0.65%) GitHub Actions
12 4 (0.65%) Serverless
13 3 (0.48%) Azure Logic Apps
13 3 (0.48%) Azure Service Bus
13 3 (0.48%) ChatGPT
13 3 (0.48%) GitHub Copilot
13 3 (0.48%) Google Gemini
13 3 (0.48%) Microsoft Copilot
Communications & Networking
1 7 (1.13%) Multicast
2 6 (0.97%) TCP/IP
3 4 (0.65%) SAN
4 2 (0.32%) DHCP
4 2 (0.32%) DNS
4 2 (0.32%) Firewall
4 2 (0.32%) Kerberos
5 1 (0.16%) FIX Connectivity
5 1 (0.16%) NetScaler
5 1 (0.16%) tcpdump
5 1 (0.16%) VPN
5 1 (0.16%) WAN
5 1 (0.16%) Wireshark
Database & Business Intelligence
1 85 (13.73%) Amazon Athena
1 85 (13.73%) Apache Arrow
1 85 (13.73%) Apache Iceberg
1 85 (13.73%) Dremio
2 80 (12.92%) PostgreSQL
3 48 (7.75%) Data Lake
4 46 (7.43%) Apache Ignite
5 30 (4.85%) SQL Server
6 17 (2.75%) Power BI
7 13 (2.10%) Relational Database
8 11 (1.78%) KDB
9 10 (1.62%) NoSQL
10 9 (1.45%) Tableau
11 6 (0.97%) RDBMS
12 4 (0.65%) Kdb+
13 3 (0.48%) Power Query
14 2 (0.32%) Big Data
14 2 (0.32%) ClickHouse
14 2 (0.32%) Delta Lake
14 2 (0.32%) MongoDB
Development Applications
1 37 (5.98%) JIRA
2 20 (3.23%) Git
3 15 (2.42%) Bitbucket
4 11 (1.78%) TeamCity
5 7 (1.13%) Maven
6 6 (0.97%) Cucumber
6 6 (0.97%) Eclipse
6 6 (0.97%) GCC
6 6 (0.97%) GDB
6 6 (0.97%) IntelliJ
6 6 (0.97%) Jenkins
7 4 (0.65%) Atlassian Bamboo
7 4 (0.65%) Gradle
8 3 (0.48%) Visual Studio
9 2 (0.32%) Cypress.io
9 2 (0.32%) GitLab
9 2 (0.32%) QUnit
9 2 (0.32%) Subversion
9 2 (0.32%) TestRail
10 1 (0.16%) Postman
General
1 412 (66.56%) Finance
2 243 (39.26%) Banking
3 177 (28.59%) Social Skills
4 141 (22.78%) Investment Banking
5 78 (12.60%) Analytical Skills
6 41 (6.62%) Back Office
7 27 (4.36%) Financial Institution
8 12 (1.94%) Organisational Skills
9 8 (1.29%) Influencing Skills
9 8 (1.29%) International Banking
10 5 (0.81%) Presentation Skills
11 4 (0.65%) Corporate Banking
11 4 (0.65%) Documentation Skills
11 4 (0.65%) Inclusion and Diversity
11 4 (0.65%) Legal
11 4 (0.65%) Public Sector
12 3 (0.48%) Retail
13 2 (0.32%) Japanese Language
13 2 (0.32%) Retail Banking
Job Titles
1 268 (43.30%) Developer
2 170 (27.46%) Software Engineer
3 142 (22.94%) Analyst
4 106 (17.12%) Business Analyst
5 103 (16.64%) Developer/Software Engineer
6 102 (16.48%) Senior
7 85 (13.73%) AWS Engineer
7 85 (13.73%) AWS Software Engineer
8 71 (11.47%) Python Engineer
8 71 (11.47%) Python Software Engineer
9 66 (10.66%) Java Engineer
9 66 (10.66%) Java Software Engineer
10 64 (10.34%) Python Developer
11 56 (9.05%) React Developer
12 52 (8.40%) C# Developer
13 51 (8.24%) Senior Software Engineer
14 46 (7.43%) Senior Java Engineer
14 46 (7.43%) Senior Java Software Engineer
15 44 (7.11%) Front Office Developer
16 42 (6.79%) Java Developer
Libraries, Frameworks & Software Standards
1 136 (21.97%) React
2 88 (14.22%) NumPy
2 88 (14.22%) Pandas
3 85 (13.73%) Node.js
4 82 (13.25%) SciPy
5 72 (11.63%) AngularJS
6 68 (10.99%) .NET
7 64 (10.34%) Redux
8 54 (8.72%) gRPC
9 52 (8.40%) Protocol Buffers
10 51 (8.24%) Vue
11 37 (5.98%) Kafka
12 32 (5.17%) FIX Protocol
13 23 (3.72%) GraphQL
14 20 (3.23%) Reactive Extensions
15 19 (3.07%) Middleware
16 15 (2.42%) REST
17 12 (1.94%) HTML
18 11 (1.78%) .NET Framework
18 11 (1.78%) HTML5
Miscellaneous
1 253 (40.87%) Fixed Income
2 193 (31.18%) Foreign Exchange (FX)
3 160 (25.85%) Derivative
4 146 (23.59%) Equities
5 109 (17.61%) Hedge funds
6 47 (7.59%) Pricing Data
7 27 (4.36%) Product Ownership
8 26 (4.20%) Onboarding
9 25 (4.04%) Algorithms
9 25 (4.04%) Greenfield Project
10 21 (3.39%) Data Structures
11 17 (2.75%) Market Risk
12 15 (2.42%) Distributed Systems
13 14 (2.26%) Credit Risk
14 13 (2.10%) Data Protection Act
15 12 (1.94%) Equity Derivative
16 11 (1.78%) Virtual Team
17 9 (1.45%) Cloud Native
17 9 (1.45%) Reference Data
18 8 (1.29%) Enterprise Software
Operating Systems
1 36 (5.82%) Linux
2 29 (4.68%) Windows
3 14 (2.26%) Unix
4 6 (0.97%) Windows Server
5 3 (0.48%) Red Hat Enterprise Linux
6 2 (0.32%) Windows 10
7 1 (0.16%) Windows Server 2016
7 1 (0.16%) Windows Server 2019
Processes & Methodologies
1 297 (47.98%) Agile
2 203 (32.79%) Investment Management
3 201 (32.47%) Asset Management
4 188 (30.37%) Software Engineering
5 109 (17.61%) Risk Management
6 88 (14.22%) Fintech
7 81 (13.09%) Problem-Solving
8 79 (12.76%) Business Analysis
9 78 (12.60%) Analytics
10 70 (11.31%) Stakeholder Management
11 58 (9.37%) Order Management
12 54 (8.72%) Full-Stack Development
12 54 (8.72%) Portfolio Management
13 52 (8.40%) Electronic Trading
14 50 (8.08%) User Acceptance Testing
15 49 (7.92%) Business Intelligence
15 49 (7.92%) Scrum
16 47 (7.59%) Computer Science
16 47 (7.59%) Performance Attribution
16 47 (7.59%) Project Management
Programming Languages
1 293 (47.33%) Python
2 175 (28.27%) TypeScript
3 173 (27.95%) JavaScript
4 143 (23.10%) Java
5 138 (22.29%) SQL
6 99 (15.99%) C#
7 42 (6.79%) C++
8 13 (2.10%) VBA
9 12 (1.94%) Go
10 11 (1.78%) PowerShell
11 7 (1.13%) Bash
11 7 (1.13%) Bicep
12 5 (0.81%) F#
12 5 (0.81%) Haskell
12 5 (0.81%) Scala
13 4 (0.65%) T-SQL
14 3 (0.48%) OCaml
15 2 (0.32%) PL/SQL
16 1 (0.16%) VB
16 1 (0.16%) VB.NET
Qualifications
1 56 (9.05%) Degree
2 22 (3.55%) Computer Science Degree
3 15 (2.42%) Master's Degree
4 3 (0.48%) CFA
4 3 (0.48%) PhD
4 3 (0.48%) PMP
4 3 (0.48%) Security Cleared
4 3 (0.48%) Server+ Certification
5 2 (0.32%) ISTQB
5 2 (0.32%) PMI Certification
5 2 (0.32%) Postgraduate
6 1 (0.16%) BC Cleared
6 1 (0.16%) BPSS Clearance
6 1 (0.16%) ITIL Certification
6 1 (0.16%) Numerate Degree
Quality Assurance & Compliance
1 21 (3.39%) MiFID
2 19 (3.07%) QA
3 15 (2.42%) EMIR
4 9 (1.45%) PMO
5 6 (0.97%) Data Quality
6 4 (0.65%) Basel III
6 4 (0.65%) GDPR
6 4 (0.65%) Sarbanes-Oxley
6 4 (0.65%) SLA
7 3 (0.48%) ITGC
8 2 (0.32%) Dodd-Frank
8 2 (0.32%) P3O
9 1 (0.16%) Accessibility
9 1 (0.16%) FATCA
9 1 (0.16%) HIPAA
System Software
1 5 (0.81%) Active Directory
2 4 (0.65%) Docker
3 1 (0.16%) HDFS
3 1 (0.16%) Hyper-V
3 1 (0.16%) Oracle RAC
3 1 (0.16%) Virtual Machines
3 1 (0.16%) VMware Infrastructure
Systems Management
1 6 (0.97%) ITRS Geneos
1 6 (0.97%) Kubernetes
2 5 (0.81%) Microsoft Intune
2 5 (0.81%) SCCM
3 4 (0.65%) Terraform
4 3 (0.48%) Ansible
4 3 (0.48%) Grafana
5 2 (0.32%) Prometheus
6 1 (0.16%) Control-M
6 1 (0.16%) Data Guard
6 1 (0.16%) HP ALM
6 1 (0.16%) Rundeck
6 1 (0.16%) WSUS
6 1 (0.16%) ZABBIX
Vendors
1 40 (6.46%) Microsoft
2 39 (6.30%) Charles River
3 30 (4.85%) BISAM
4 23 (3.72%) Calypso
4 23 (3.72%) SimCorp
5 22 (3.55%) Oracle
6 18 (2.91%) Bloomberg
6 18 (2.91%) ION Trading
6 18 (2.91%) Murex
7 13 (2.10%) Databricks
8 11 (1.78%) Solace
9 7 (1.13%) ServiceNow
10 6 (0.97%) Reuters
10 6 (0.97%) Splunk
11 5 (0.81%) Atlassian
11 5 (0.81%) Salesforce
11 5 (0.81%) Sophis
12 4 (0.65%) Dynatrace
12 4 (0.65%) OpenLink
13 3 (0.48%) OpenAI