Runbook
UK

The following table provides summary statistics for contract job vacancies with a requirement for Runbook skills. Included is a benchmarking guide to the contractor rates offered in vacancies that have cited Runbook over the 6 months to 6 May 2024 with a comparison to the same period in the previous 2 years.

6 months to
6 May 2024
Same period 2023 Same period 2022
Rank 416 537 589
Rank change year-on-year +121 +52 -74
Contract jobs citing Runbook 162 180 281
As % of all contract jobs advertised in the UK 0.37% 0.30% 0.32%
As % of the Processes & Methodologies category 0.43% 0.34% 0.35%
Number of daily rates quoted 93 119 161
10th Percentile £313 £200 £385
25th Percentile £413 £413 £425
Median daily rate (50th Percentile) £500 £550 £500
Median % change year-on-year -9.09% +10.00% +6.46%
75th Percentile £600 £650 £630
90th Percentile £650 £700 £688
UK excluding London median daily rate £475 £525 £450
% change year-on-year -9.52% +16.67% +5.63%
Number of hourly rates quoted 3 1 0
10th Percentile - - -
25th Percentile - - -
Median hourly rate £18.13 £51.00 -
Median % change year-on-year -64.45% - -
75th Percentile £23.32 - -
90th Percentile £26.43 - -
UK excluding London median hourly rate £28.00 - -

All Process and Methodology Skills
UK

Runbook is in the Processes and Methodologies category. The following table is for comparison with the above and provides summary statistics for all contract job vacancies with a requirement for process or methodology skills.

Contract vacancies with a requirement for process or methodology skills 37,480 53,073 80,381
As % of all contract IT jobs advertised in the UK 86.37% 89.85% 90.59%
Number of daily rates quoted 24,166 36,804 56,457
10th Percentile £300 £325 £340
25th Percentile £413 £438 £425
Median daily rate (50th Percentile) £525 £550 £530
Median % change year-on-year -4.55% +3.77% +8.72%
75th Percentile £638 £650 £638
90th Percentile £750 £750 £738
UK excluding London median daily rate £500 £500 £475
% change year-on-year - +5.26% +8.57%
Number of hourly rates quoted 2,447 1,751 1,910
10th Percentile £12.75 £11.00 £12.50
25th Percentile £16.00 £16.25 £15.50
Median hourly rate £35.96 £36.00 £25.00
Median % change year-on-year -0.11% +44.00% +2.04%
75th Percentile £60.00 £65.00 £49.25
90th Percentile £72.50 £75.00 £65.00
UK excluding London median hourly rate £37.50 £35.00 £20.00
% change year-on-year +7.14% +75.00% -6.98%

Runbook
Job Vacancy Trend

Job postings citing Runbook as a proportion of all IT jobs advertised.
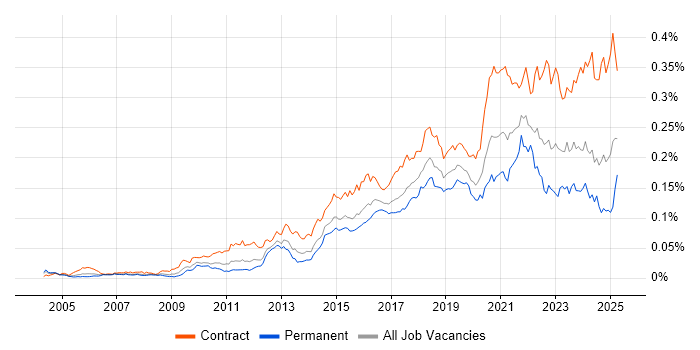
Job vacancy trend for Runbook in the UK

Runbook
Contractor Daily Rate Trend

3-month moving average daily rate quoted in jobs citing Runbook.

Daily rate trend for Runbook in the UK

Runbook
Daily Rate Histogram

Daily rate distribution for jobs citing Runbook over the 6 months to 6 May 2024.

Daily rate histogram for Runbook in the UK

Runbook
Contractor Hourly Rate Trend

3-month moving average hourly rates quoted in jobs citing Runbook.

Hourly rate trend for Runbook in the UK

Runbook
Top 13 Contract Locations

The table below looks at the demand and provides a guide to the median contractor rates quoted in IT jobs citing Runbook within the UK over the 6 months to 6 May 2024. The 'Rank Change' column provides an indication of the change in demand within each location based on the same 6 month period last year.

Location Rank Change
on Same Period
Last Year
Matching
Contract
IT Job Ads
Median
Daily Rate
Past 6 Months
Median Daily Rate
% Change
on Same Period
Last Year
Live
Jobs
England +93 136 £500 -9.09% 43
London +114 76 £500 -16.67% 24
UK excluding London +37 62 £475 -9.52% 21
Work from Home +99 48 £531 -11.46% 18
South East +26 27 £533 +166.25% 7
North of England +23 18 £380 -45.71% 8
Yorkshire +25 10 £340 -51.43% 2
Midlands +25 10 £300 -42.86% 2
West Midlands +16 10 £300 -42.86% 1
North West +15 7 £450 -35.71% 5
Scotland +35 5 £475 +18.75% 1
South West +20 2 £600 +200.00% 1
North East +14 1 - - 1

Runbook
Co-occurring Skills and Capabilities by Category

The follow tables expand on the table above by listing co-occurrences grouped by category. The same employment type, locality and period is covered with up to 20 co-occurrences shown in each of the following categories:

Application Platforms
1 12 (7.41%) nginx
2 9 (5.56%) Apache
2 9 (5.56%) JBoss
2 9 (5.56%) Tomcat
3 5 (3.09%) IIS
4 2 (1.23%) Confluence
4 2 (1.23%) Oracle Self-Service HR
4 2 (1.23%) WebSphere
5 1 (0.62%) Blackberry Enterprise Server
5 1 (0.62%) Microsoft Exchange
5 1 (0.62%) Red Hat Fuse
5 1 (0.62%) SharePoint
5 1 (0.62%) WebLogic
Applications
1 3 (1.85%) Microsoft Office
2 1 (0.62%) Microsoft Excel
2 1 (0.62%) MS Visio
Business Applications
1 9 (5.56%) Temenos T24
2 3 (1.85%) Oracle EBS
3 2 (1.23%) Oracle Cash Management
3 2 (1.23%) Oracle Financials
3 2 (1.23%) Oracle General Ledger
3 2 (1.23%) Oracle Payables
3 2 (1.23%) Oracle Receivables
4 1 (0.62%) Sparx Enterprise Architect
Cloud Services
1 60 (37.04%) Azure
2 40 (24.69%) AWS
3 16 (9.88%) Serverless
4 15 (9.26%) GitHub
5 12 (7.41%) Entra ID
6 11 (6.79%) Azure Monitor
6 11 (6.79%) Power Platform
7 10 (6.17%) GCP
8 9 (5.56%) Azure Functions
9 7 (4.32%) AWS CloudFormation
9 7 (4.32%) GitHub Actions
10 6 (3.70%) Dynamics 365
10 6 (3.70%) IaaS
11 5 (3.09%) Amazon EKS
11 5 (3.09%) Azure DevOps
11 5 (3.09%) Azure Sentinel
11 5 (3.09%) Microsoft 365
12 4 (2.47%) Azure Data Factory
12 4 (2.47%) Azure Synapse Analytics
12 4 (2.47%) Power Automate
Communications & Networking
1 27 (16.67%) DNS
1 27 (16.67%) Firewall
2 12 (7.41%) DHCP
3 9 (5.56%) LAN
3 9 (5.56%) WAN
4 8 (4.94%) Network Security
4 8 (4.94%) Remote Desktop
4 8 (4.94%) VPN
5 7 (4.32%) Cisco Nexus
5 7 (4.32%) SSL
5 7 (4.32%) Wi-Fi
5 7 (4.32%) Wireless
6 6 (3.70%) BGP
6 6 (3.70%) IPsec
6 6 (3.70%) MPLS
6 6 (3.70%) OSPF
6 6 (3.70%) SD-WAN
6 6 (3.70%) VXLAN
7 4 (2.47%) Cisco Wireless
7 4 (2.47%) TCP/IP
Database & Business Intelligence
1 15 (9.26%) SQL Server
2 14 (8.64%) RDBMS
2 14 (8.64%) Relational Database
3 11 (6.79%) Power BI
4 9 (5.56%) MySQL
5 7 (4.32%) PostgreSQL
6 6 (3.70%) MongoDB
7 4 (2.47%) Data Warehouse
7 4 (2.47%) Metadata
7 4 (2.47%) SQL Server Integration Services
8 2 (1.23%) DynamoDB
9 1 (0.62%) Oracle Database
9 1 (0.62%) SQLite
Development Applications
1 9 (5.56%) GitLab
2 8 (4.94%) Git
3 6 (3.70%) JIRA
4 4 (2.47%) Browser DevTools
4 4 (2.47%) Burp Suite
5 3 (1.85%) Cypress.io
6 2 (1.23%) Jenkins
6 2 (1.23%) Selenium
7 1 (0.62%) GoCD
7 1 (0.62%) JUnit
7 1 (0.62%) Sonatype Nexus
7 1 (0.62%) Subversion
General
1 47 (29.01%) Finance
1 47 (29.01%) Social Skills
2 22 (13.58%) Analytical Skills
3 12 (7.41%) Banking
4 6 (3.70%) Documentation Skills
5 4 (2.47%) Back Office
5 4 (2.47%) Public Sector
6 3 (1.85%) Police
6 3 (1.85%) Telecoms
7 1 (0.62%) Aerospace
7 1 (0.62%) Influencing Skills
7 1 (0.62%) Legal
7 1 (0.62%) Manufacturing
7 1 (0.62%) Marketing
7 1 (0.62%) Pharmaceutical
7 1 (0.62%) Retail
Job Titles
1 18 (11.11%) Analyst
2 14 (8.64%) Senior
3 12 (7.41%) Business Analyst
4 11 (6.79%) Linux Engineer
5 9 (5.56%) IT Engineer
5 9 (5.56%) Support Engineer
6 8 (4.94%) Consultant
6 8 (4.94%) Project Manager
7 6 (3.70%) Applications Engineer
7 6 (3.70%) Applications Support
7 6 (3.70%) AWS Engineer
7 6 (3.70%) Data Centre Engineer
7 6 (3.70%) DevOps Engineer
7 6 (3.70%) Infrastructure Engineer
7 6 (3.70%) Network Engineer
7 6 (3.70%) Security Engineer
8 5 (3.09%) Cutover Manager
8 5 (3.09%) Operations Analyst
8 5 (3.09%) Operations Business Analyst
8 5 (3.09%) Platform Engineer
Libraries, Frameworks & Software Standards
1 9 (5.56%) IBM Integration Bus
2 8 (4.94%) Middleware
3 6 (3.70%) Node.js
4 5 (3.09%) YAML
5 4 (2.47%) ARM Templates
5 4 (2.47%) Microsoft Graph
6 3 (1.85%) ADO
6 3 (1.85%) Jest
6 3 (1.85%) Lambda Expressions
6 3 (1.85%) React
6 3 (1.85%) REST
7 2 (1.23%) .NET
7 2 (1.23%) .NET Framework
7 2 (1.23%) CSS
7 2 (1.23%) CSS3
7 2 (1.23%) HTML
7 2 (1.23%) HTML5
7 2 (1.23%) OpenID
7 2 (1.23%) React Native
7 2 (1.23%) SAML
Miscellaneous
1 13 (8.02%) Data Centre
2 12 (7.41%) Linux Command Line
3 6 (3.70%) Management Information System
4 4 (2.47%) DTCC
4 4 (2.47%) Equities
4 4 (2.47%) PKI
4 4 (2.47%) Team-Oriented Environment
5 3 (1.85%) Cyber Threat
5 3 (1.85%) Smart Meter
6 2 (1.23%) Cloud Native
6 2 (1.23%) Clustering
6 2 (1.23%) Onboarding
6 2 (1.23%) Product Ownership
7 1 (0.62%) CMDB
7 1 (0.62%) Cyberattack
7 1 (0.62%) Hybrid Cloud
7 1 (0.62%) Public Cloud
7 1 (0.62%) Replication
7 1 (0.62%) Security Operations Centre
7 1 (0.62%) Virtual Team
Operating Systems
1 42 (25.93%) Windows
2 34 (20.99%) Linux
3 18 (11.11%) Red Hat Enterprise Linux
4 17 (10.49%) Unix
5 12 (7.41%) Windows Server
6 10 (6.17%) VMS
7 7 (4.32%) Windows 10
7 7 (4.32%) Windows 7
8 4 (2.47%) Ubuntu
9 3 (1.85%) Solaris
9 3 (1.85%) Windows Server 2016
10 2 (1.23%) Android
10 2 (1.23%) Apple iOS
10 2 (1.23%) Windows Server 2003
11 1 (0.62%) Mac OS
11 1 (0.62%) Mac OS X
11 1 (0.62%) Windows Mobile
11 1 (0.62%) Windows Server 2012
Processes & Methodologies
1 33 (20.37%) Problem-Solving
2 31 (19.14%) Migration
3 22 (13.58%) Incident Management
4 17 (10.49%) Agile
4 17 (10.49%) DevOps
5 16 (9.88%) CI/CD
5 16 (9.88%) Roadmaps
6 14 (8.64%) Project Delivery
7 13 (8.02%) ITIL
7 13 (8.02%) Validation
8 12 (7.41%) Computer Science
8 12 (7.41%) Continuous Improvement
8 12 (7.41%) Product Roadmap
9 11 (6.79%) Acceptance Criteria
9 11 (6.79%) Asset Management
9 11 (6.79%) ITSM
9 11 (6.79%) Problem Management
9 11 (6.79%) Project Management
10 10 (6.17%) Server Management
10 10 (6.17%) Technical Leadership
Programming Languages
1 30 (18.52%) Python
2 29 (17.90%) PowerShell
3 12 (7.41%) Bash
4 11 (6.79%) Shell Script
4 11 (6.79%) SQL
5 10 (6.17%) Java
6 8 (4.94%) JavaScript
7 6 (3.70%) TypeScript
8 4 (2.47%) Go
9 3 (1.85%) Kotlin
9 3 (1.85%) Kusto Query Language
10 2 (1.23%) C#
10 2 (1.23%) VBScript
11 1 (0.62%) Perl
11 1 (0.62%) PHP
Qualifications
1 22 (13.58%) Security Cleared
2 20 (12.35%) SC Cleared
3 18 (11.11%) Degree
4 12 (7.41%) Computer Science Degree
5 11 (6.79%) Cisco Certification
6 7 (4.32%) CCNA
6 7 (4.32%) CCNP
6 7 (4.32%) VMware Certified Professional (VCP)
7 4 (2.47%) A+ Certification
7 4 (2.47%) Network+ Certification
8 3 (1.85%) CISM
8 3 (1.85%) CISSP
8 3 (1.85%) CompTIA Security+
9 2 (1.23%) CCIE
9 2 (1.23%) Oracle Certification
10 1 (0.62%) BPSS Clearance
10 1 (0.62%) JNCIA
10 1 (0.62%) JNCIS
Quality Assurance & Compliance
1 9 (5.56%) SLA
2 7 (4.32%) QA
3 4 (2.47%) Accessibility
4 3 (1.85%) ISO/IEC 27001
5 1 (0.62%) Data Quality
5 1 (0.62%) GDPR
5 1 (0.62%) ISO/IEC 20000
5 1 (0.62%) PMO
System Software
1 25 (15.43%) Active Directory
2 13 (8.02%) VMware Infrastructure
3 9 (5.56%) Virtual Machines
3 9 (5.56%) vSphere
4 7 (4.32%) KVM
4 7 (4.32%) VMware ESXi
4 7 (4.32%) VMware Workstation
5 6 (3.70%) Firmware
6 5 (3.09%) Hyper-V
6 5 (3.09%) Virtual Desktop
7 3 (1.85%) Docker
7 3 (1.85%) VMware NSX
8 2 (1.23%) Ceph
8 2 (1.23%) Veritas Cluster Server
8 2 (1.23%) XenApp
Systems Management
1 18 (11.11%) Ansible
2 16 (9.88%) Terraform
3 10 (6.17%) Kubernetes
4 8 (4.94%) vCenter Server
5 7 (4.32%) SCCM
6 6 (3.70%) Packer
6 6 (3.70%) vRealize
7 5 (3.09%) SysTrack
8 4 (2.47%) SCOrch
8 4 (2.47%) Single Sign-On
9 3 (1.85%) Red Hat Satellite
10 2 (1.23%) Microsoft Intune
10 2 (1.23%) Pacemaker
10 2 (1.23%) Podman
10 2 (1.23%) SCOM
11 1 (0.62%) CASB
11 1 (0.62%) Microsoft Clustering
11 1 (0.62%) Oracle Enterprise Manager
11 1 (0.62%) SCVMM
11 1 (0.62%) VxRail
Vendors
1 28 (17.28%) Microsoft
2 22 (13.58%) Oracle
3 20 (12.35%) VMware
4 16 (9.88%) Red Hat
5 12 (7.41%) Cisco
5 12 (7.41%) IBM
6 9 (5.56%) CyberArk
6 9 (5.56%) Temenos
7 7 (4.32%) Citrix
8 6 (3.70%) F5
8 6 (3.70%) Infoblox
8 6 (3.70%) Okta
8 6 (3.70%) SolarWinds
8 6 (3.70%) Veritas
9 5 (3.09%) Arqiva
9 5 (3.09%) New Relic
9 5 (3.09%) OpenAI
9 5 (3.09%) ServiceNow
9 5 (3.09%) Splunk
10 4 (2.47%) Dell