Business Continuity Jobs in London

Business Continuity
England > London

The following table provides summary statistics for permanent job vacancies advertised in London with a requirement for Business Continuity skills. Included is a benchmarking guide to the salaries offered in vacancies that have cited Business Continuity over the 6 months to 18 May 2024 with a comparison to the same period in the previous 2 years.

6 months to
18 May 2024
Same period 2023 Same period 2022
Rank 257 419 494
Rank change year-on-year +162 +75 -35
Permanent jobs citing Business Continuity 276 205 460
As % of all permanent jobs advertised in London 1.17% 0.61% 0.66%
As % of the Processes & Methodologies category 1.28% 0.64% 0.69%
Number of salaries quoted 172 161 260
10th Percentile £47,000 £41,250 £35,787
25th Percentile £52,238 £51,475 £49,750
Median annual salary (50th Percentile) £75,000 £65,000 £64,125
Median % change year-on-year +15.38% +1.36% +11.52%
75th Percentile £80,000 £95,000 £84,063
90th Percentile £90,000 £115,000 £100,000
England median annual salary £57,500 £55,075 £52,500
% change year-on-year +4.40% +4.90% -4.55%

All Process and Methodology Skills
London

Business Continuity is in the Processes and Methodologies category. The following table is for comparison with the above and provides summary statistics for all permanent job vacancies advertised in London with a requirement for process or methodology skills.

Permanent vacancies with a requirement for process or methodology skills 21,526 32,049 67,099
As % of all permanent jobs advertised in London 90.97% 95.35% 97.00%
Number of salaries quoted 15,906 23,132 34,106
10th Percentile £37,500 £43,257 £42,500
25th Percentile £51,500 £55,000 £53,750
Median annual salary (50th Percentile) £70,500 £75,000 £70,000
Median % change year-on-year -6.00% +7.14% -
75th Percentile £95,000 £95,000 £92,500
90th Percentile £115,000 £115,000 £110,500
England median annual salary £55,000 £62,500 £60,000
% change year-on-year -12.00% +4.17% +9.09%

Business Continuity
Job Vacancy Trend in London

Job postings citing Business Continuity as a proportion of all IT jobs advertised in London.
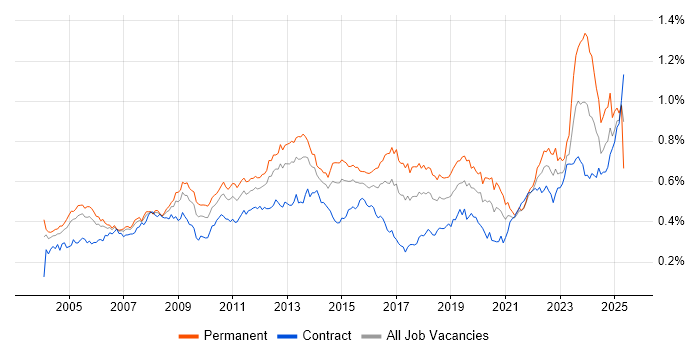
Job vacancy trend for Business Continuity in London

Business Continuity
Salary Trend in London

3-month moving average salary quoted in jobs citing Business Continuity in London.

Salary trend for Business Continuity in London

Business Continuity
Salary Histogram in London

Salary distribution for jobs citing Business Continuity in London over the 6 months to 18 May 2024.

Salary histogram for Business Continuity in London

Business Continuity
Job Locations in London

The table below looks at the demand and provides a guide to the median salaries quoted in IT jobs citing Business Continuity within the London region over the 6 months to 18 May 2024. The 'Rank Change' column provides an indication of the change in demand within each location based on the same 6 month period last year.

Location Rank Change
on Same Period
Last Year
Matching
Permanent
IT Job Ads
Median Salary
Past 6 Months
Median Salary
% Change
on Same Period
Last Year
Live
Jobs
Central London +65 38 £55,000 -26.67% 13
South London -5 2 £65,000 +8.33% 1
East London +21 1 £55,000 +3.77% 4
West London -6 1 - - 5
Business Continuity
England

Business Continuity
Co-occurring Skills and Capabilities in London by Category

The follow tables expand on the table above by listing co-occurrences grouped by category. The same employment type, locality and period is covered with up to 20 co-occurrences shown in each of the following categories:

Application Platforms
1 87 (31.52%) Microsoft Exchange
2 7 (2.54%) SharePoint
3 3 (1.09%) SAS
4 2 (0.72%) Apache
Applications
1 6 (2.17%) Microsoft Office
2 3 (1.09%) Microsoft Excel
2 3 (1.09%) Microsoft PowerPoint
2 3 (1.09%) SPSS
3 2 (0.72%) MS Visio
Business Applications
1 6 (2.17%) Dynamics CRM
2 1 (0.36%) SAP Business One
Cloud Services
1 115 (41.67%) Microsoft 365
2 56 (20.29%) Azure
3 25 (9.06%) AWS
4 13 (4.71%) GCP
4 13 (4.71%) Nutanix
4 13 (4.71%) Power Platform
5 11 (3.99%) Google Workspace
6 10 (3.62%) Amazon S3
7 8 (2.90%) PaaS
8 7 (2.54%) GitHub
9 6 (2.17%) Azure DevOps
9 6 (2.17%) Azure Monitor
9 6 (2.17%) Cloud Computing
9 6 (2.17%) Power Automate
9 6 (2.17%) PowerApps
9 6 (2.17%) SaaS
10 5 (1.81%) Entra ID
10 5 (1.81%) IaaS
11 3 (1.09%) AWS CodeDeploy
11 3 (1.09%) OpenShift
Communications & Networking
1 102 (36.96%) Wireless
2 97 (35.14%) WAN
3 93 (33.70%) SD-WAN
4 86 (31.16%) Cisco IOS
4 86 (31.16%) WebEx
5 64 (23.19%) Firewall
6 40 (14.49%) DNS
7 22 (7.97%) TCP/IP
8 21 (7.61%) Intrusion Detection
9 20 (7.25%) DHCP
10 16 (5.80%) SAN
11 15 (5.43%) Internet
12 14 (5.07%) NAS
13 11 (3.99%) Broadband
13 11 (3.99%) LAN
13 11 (3.99%) tcpdump
13 11 (3.99%) VPN
14 9 (3.26%) SNMP
15 8 (2.90%) Wi-Fi
16 7 (2.54%) Network Security
Database & Business Intelligence
1 14 (5.07%) SQL Server
2 13 (4.71%) SQL Server Reporting Services
3 12 (4.35%) Elasticsearch
4 9 (3.26%) MongoDB
4 9 (3.26%) MySQL
5 8 (2.90%) Oracle Database
6 7 (2.54%) Data Warehouse
6 7 (2.54%) Power BI
6 7 (2.54%) SQL Server Analysis Services
6 7 (2.54%) SQL Server Integration Services
7 6 (2.17%) Azure SQL Database
8 3 (1.09%) Big Data
8 3 (1.09%) EDRMS
9 1 (0.36%) Amazon RDS
9 1 (0.36%) NoSQL
Development Applications
1 14 (5.07%) Jenkins
2 12 (4.35%) Git
3 10 (3.62%) JIRA
4 6 (2.17%) Visual Studio
5 3 (1.09%) Bitbucket
5 3 (1.09%) CircleCI
5 3 (1.09%) GitLab
5 3 (1.09%) JUnit
5 3 (1.09%) Selenium
5 3 (1.09%) Subversion
5 3 (1.09%) TestNG
5 3 (1.09%) Travis CI
General
1 160 (57.97%) Social Skills
2 59 (21.38%) Finance
3 55 (19.93%) Analytical Skills
4 37 (13.41%) Legal
5 24 (8.70%) Law
6 18 (6.52%) Banking
7 14 (5.07%) Games
7 14 (5.07%) Telecoms
8 13 (4.71%) Organisational Skills
9 12 (4.35%) Documentation Skills
9 12 (4.35%) Front Office
10 8 (2.90%) Back Office
11 5 (1.81%) Presentation Skills
12 3 (1.09%) Inclusion and Diversity
12 3 (1.09%) Influencing Skills
12 3 (1.09%) Investment Banking
12 3 (1.09%) Manufacturing
12 3 (1.09%) Marketing
12 3 (1.09%) Police
12 3 (1.09%) Public Sector
Job Titles
1 88 (31.88%) IT Support
1 88 (31.88%) IT Support Specialist
1 88 (31.88%) Support Specialist
2 36 (13.04%) Senior
3 30 (10.87%) Analyst
4 22 (7.97%) Lead
5 13 (4.71%) Storage Specialist
6 12 (4.35%) Consultant
6 12 (4.35%) Virtualisation Specialist
7 11 (3.99%) IT Consultant
8 10 (3.62%) Linux Engineer
8 10 (3.62%) Senior Linux Engineer
9 9 (3.26%) DevOps Engineer
9 9 (3.26%) IT Manager
9 9 (3.26%) Senior DevOps
9 9 (3.26%) Senior DevOps Engineer
10 8 (2.90%) Applications Support
10 8 (2.90%) Linux/Unix DevOps
10 8 (2.90%) Resilience Manager
10 8 (2.90%) Support Analyst
Libraries, Frameworks & Software Standards
1 14 (5.07%) Elastic Stack
2 13 (4.71%) ARM Templates
3 12 (4.35%) YAML
4 8 (2.90%) FIX Protocol
5 6 (2.17%) Web Services
6 2 (0.72%) Keycloak
6 2 (0.72%) Middleware
7 1 (0.36%) Node.js
Miscellaneous
1 97 (35.14%) Video Conferencing
2 86 (31.16%) Wiki
3 35 (12.68%) Management Information System
4 33 (11.96%) Security Posture
5 19 (6.88%) Onboarding
6 16 (5.80%) Clustering
7 12 (4.35%) Data Centre
8 11 (3.99%) Replication
9 6 (2.17%) AS400
10 5 (1.81%) Self-Motivation
11 4 (1.45%) Freedom of Information
12 3 (1.09%) Blog
12 3 (1.09%) Cybercrime
12 3 (1.09%) Derivative
13 2 (0.72%) Cyber Threat
13 2 (0.72%) Hedge funds
13 2 (0.72%) Public Cloud
13 2 (0.72%) Team-Oriented Environment
14 1 (0.36%) Cyber Security Posture
14 1 (0.36%) Enterprise Software
Operating Systems
1 152 (55.07%) Windows
2 87 (31.52%) Android
2 87 (31.52%) Windows 10
3 36 (13.04%) Windows Server
4 22 (7.97%) Linux
5 11 (3.99%) Mac OS
6 8 (2.90%) Unix
7 4 (1.45%) CentOS
8 2 (0.72%) Ubuntu
8 2 (0.72%) Windows Server 2019
9 1 (0.36%) Apple iOS
9 1 (0.36%) Mac OS X
Processes & Methodologies
1 134 (48.55%) Business Continuity Planning
2 129 (46.74%) Disaster Recovery
3 128 (46.38%) BCP
4 97 (35.14%) Mobile Device Management
5 96 (34.78%) Cybersecurity
6 94 (34.06%) Computer Science
7 90 (32.61%) Contract Negotiation
8 86 (31.16%) Application Virtualisation
9 57 (20.65%) Problem-Solving
10 55 (19.93%) ITIL
11 45 (16.30%) Information Security
12 39 (14.13%) High Availability
13 28 (10.14%) Performance Tuning
14 27 (9.78%) Risk Management
15 23 (8.33%) Change Management
16 21 (7.61%) Continuous Improvement
17 20 (7.25%) Asset Management
18 19 (6.88%) DevOps
18 19 (6.88%) Task Automation
19 18 (6.52%) Penetration Testing
Programming Languages
1 38 (13.77%) PowerShell
2 25 (9.06%) Bash
3 19 (6.88%) SQL
4 14 (5.07%) Python
5 13 (4.71%) T-SQL
6 11 (3.99%) Perl
7 10 (3.62%) RPG
8 2 (0.72%) Java
8 2 (0.72%) Shell Script
Qualifications
1 133 (48.19%) Degree
2 90 (32.61%) Computer Science Degree
3 88 (31.88%) Master's Degree
4 31 (11.23%) CISSP
5 19 (6.88%) Microsoft Certification
6 17 (6.16%) GIAC
7 16 (5.80%) CompTIA Security+
8 15 (5.43%) CompTIA CySA+
9 13 (4.71%) MCSE
9 13 (4.71%) VMware Certified Professional (VCP)
10 12 (4.35%) CISM
10 12 (4.35%) GSEC
10 12 (4.35%) SSCP
11 11 (3.99%) CISA
12 7 (2.54%) CEH
12 7 (2.54%) Cisco Certification
13 6 (2.17%) CRISC
13 6 (2.17%) MCSA
14 5 (1.81%) Postgraduate
15 4 (1.45%) CCNP
Quality Assurance & Compliance
1 48 (17.39%) ISO/IEC 27001
2 21 (7.61%) Cyber Essentials
3 14 (5.07%) GDPR
4 11 (3.99%) SOC 2
5 9 (3.26%) Cyber Essentials PLUS
6 7 (2.54%) COBIT
7 6 (2.17%) ISO 22301
7 6 (2.17%) NCSC
7 6 (2.17%) NIST
8 4 (1.45%) ITGC
9 3 (1.09%) QA
10 2 (0.72%) HIPAA
11 1 (0.36%) GRC
11 1 (0.36%) NEBOSH
11 1 (0.36%) NIST 800
11 1 (0.36%) PMO
System Software
1 117 (42.39%) Active Directory
2 105 (38.04%) VMware ESXi
3 86 (31.16%) Microsoft App-V
3 86 (31.16%) XenApp
3 86 (31.16%) XenDesktop
4 41 (14.86%) VMware Infrastructure
5 13 (4.71%) Virtual Servers
6 12 (4.35%) Docker
7 10 (3.62%) Firmware
8 5 (1.81%) Virtual Machines
9 4 (1.45%) Hyper-V
10 3 (1.09%) VirtualBox
11 2 (0.72%) KVM
Systems Management
1 86 (31.16%) AirWatch
1 86 (31.16%) SCCM
2 24 (8.70%) Ansible
3 21 (7.61%) Nagios
4 17 (6.16%) Terraform
5 14 (5.07%) Puppet
6 12 (4.35%) Single Sign-On
7 11 (3.99%) Grafana
7 11 (3.99%) Graphite
8 10 (3.62%) SCOM
9 9 (3.26%) HAProxy
9 9 (3.26%) vCenter Server
10 7 (2.54%) Foglight
10 7 (2.54%) Microsoft Clustering
11 5 (1.81%) Kubernetes
11 5 (1.81%) Microsoft Intune
11 5 (1.81%) Progress Chef
11 5 (1.81%) ZABBIX
12 3 (1.09%) Kibana
12 3 (1.09%) logstash
Vendors
1 134 (48.55%) Microsoft
2 98 (35.51%) Cisco
3 89 (32.25%) Citrix
4 41 (14.86%) VMware
5 24 (8.70%) Veeam
6 21 (7.61%) HP
7 18 (6.52%) IBM
8 14 (5.07%) Oracle
9 13 (4.71%) Commvault
9 13 (4.71%) Nimble Storage
10 12 (4.35%) Google
11 11 (3.99%) Apple
12 10 (3.62%) Dell
12 10 (3.62%) NetApp
13 9 (3.26%) ServiceNow
14 8 (2.90%) Algorithmics
14 8 (2.90%) ION Trading
15 7 (2.54%) ArcSight
15 7 (2.54%) Splunk
15 7 (2.54%) Sun