IT Strategy Jobs in London

IT/Technology Strategy
England > London

The table below provides summary statistics for permanent job vacancies advertised in London requiring IT Strategy skills. It includes a benchmarking guide to the annual salaries offered in vacancies that cited IT Strategy over the 6 months leading up to 30 May 2025, comparing them to the same period in the previous two years.

6 months to
30 May 2025
Same period 2024 Same period 2023
Rank 202 140 227
Rank change year-on-year -62 +87 +88
Permanent jobs citing IT Strategy 213 545 514
As % of all permanent jobs advertised in London 1.68% 2.27% 1.57%
As % of the Processes & Methodologies category 1.74% 2.52% 1.65%
Number of salaries quoted 113 251 310
10th Percentile £57,500 £47,750 £46,250
25th Percentile £66,750 £61,250 £68,750
Median annual salary (50th Percentile) £85,000 £85,000 £85,000
Median % change year-on-year - - +9.68%
75th Percentile £110,000 £105,000 £110,000
90th Percentile £120,000 £130,000 £122,500
England median annual salary £68,500 £65,000 £77,500
% change year-on-year +5.38% -16.13% +14.81%

All Process and Methodology Skills
London

IT Strategy falls under the Processes and Methodologies category. For comparison with the information above, the following table provides summary statistics for all permanent job vacancies requiring process or methodology skills in London.

Permanent vacancies with a requirement for process or methodology skills 12,216 21,652 31,243
As % of all permanent jobs advertised in London 96.26% 90.32% 95.32%
Number of salaries quoted 6,929 15,871 22,511
10th Percentile £41,700 £37,500 £42,789
25th Percentile £55,500 £51,250 £55,000
Median annual salary (50th Percentile) £75,000 £70,000 £75,000
Median % change year-on-year +7.14% -6.67% +7.14%
75th Percentile £100,000 £95,000 £95,000
90th Percentile £122,500 £115,000 £115,055
England median annual salary £57,500 £55,000 £62,500
% change year-on-year +4.55% -12.00% +4.17%

IT Strategy
Job Vacancy Trend in London

Job postings citing IT Strategy as a proportion of all IT jobs advertised in London.
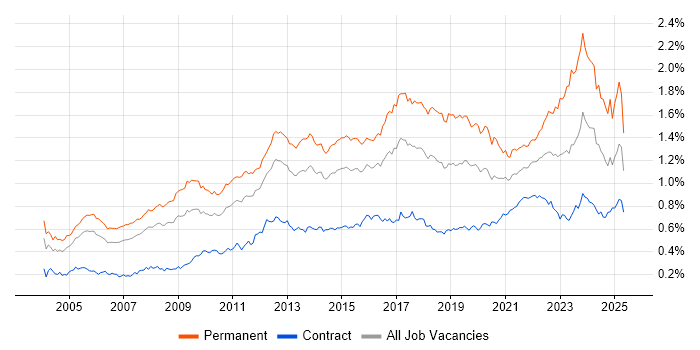
Job vacancy trend for IT Strategy in London

IT Strategy
Salary Trend in London

3-month moving average salary quoted in jobs citing IT Strategy in London.

Salary trend for IT Strategy in London

IT Strategy
Salary Histogram in London

Salary distribution for jobs citing IT Strategy in London over the 6 months to 30 May 2025.

Salary histogram for IT Strategy in London

IT Strategy
Job Locations in London

The table below looks at the demand and provides a guide to the median salaries quoted in IT jobs citing IT Strategy within the London region over the 6 months to 30 May 2025. The 'Rank Change' column provides an indication of the change in demand within each location based on the same 6 month period last year.

Location Rank Change
on Same Period
Last Year
Matching
Permanent
IT Job Ads
Median Salary
Past 6 Months
Median Salary
% Change
on Same Period
Last Year
Live
Jobs
Central London -1 46 £80,000 -12.33% 15
West London -29 15 £92,500 +19.35% 27
South London -26 3 £72,500 +7.41% 3
North London - 2 £65,000 - 1
IT Strategy
England

IT Strategy
Co-occurring Skills and Capabilities in London by Category

The follow tables expand on the table above by listing co-occurrences grouped by category. The same employment type, locality and period is covered with up to 20 co-occurrences shown in each of the following categories:

Application Platforms
1 8 (3.76%) CMS
2 7 (3.29%) SharePoint
3 6 (2.82%) Microsoft Exchange
3 6 (2.82%) Moodle
4 3 (1.41%) Apache Spark
5 2 (0.94%) WordPress
6 1 (0.47%) Drupal
6 1 (0.47%) IIS
6 1 (0.47%) SAS
Applications
1 25 (11.74%) Maya
2 7 (3.29%) Microsoft Office
3 5 (2.35%) Chatbot
4 2 (0.94%) Adobe XD
4 2 (0.94%) MS Visio
4 2 (0.94%) Sketch
Business Applications
1 13 (6.10%) Dynamics CRM
2 5 (2.35%) SAP S/4HANA
3 4 (1.88%) Endur
4 3 (1.41%) SAP CX
5 2 (0.94%) Adaptiv
5 2 (0.94%) Fidessa
6 1 (0.47%) Carpe Diem
6 1 (0.47%) Dynamics NAV
6 1 (0.47%) Elite 3E
6 1 (0.47%) Lorenzo
6 1 (0.47%) Oracle ERP
6 1 (0.47%) Shopify
6 1 (0.47%) SystmOne
Cloud Services
1 74 (34.74%) Azure
2 35 (16.43%) Microsoft 365
3 30 (14.08%) AWS
4 24 (11.27%) GCP
5 23 (10.80%) Power Platform
6 17 (7.98%) SaaS
7 15 (7.04%) Cloud Computing
8 12 (5.63%) Entra ID
9 11 (5.16%) Boomi
9 11 (5.16%) Salesforce Commerce Cloud
10 9 (4.23%) Azure DevOps
10 9 (4.23%) Microsoft Copilot
11 7 (3.29%) Google Analytics
12 6 (2.82%) Dynamics 365
12 6 (2.82%) PaaS
13 4 (1.88%) IaaS
14 3 (1.41%) Oracle CX
14 3 (1.41%) Snowflake
15 2 (0.94%) Azure Monitor
15 2 (0.94%) Nutanix
Communications & Networking
1 18 (8.45%) Firewall
2 8 (3.76%) Internet
3 7 (3.29%) VPN
4 6 (2.82%) Network Security
4 6 (2.82%) Wi-Fi
5 5 (2.35%) DNS
6 3 (1.41%) DHCP
6 3 (1.41%) NAS
6 3 (1.41%) SAN
6 3 (1.41%) TCP/IP
6 3 (1.41%) Wireless
7 2 (0.94%) Kerberos
7 2 (0.94%) NetScaler
7 2 (0.94%) SD-WAN
7 2 (0.94%) WAN
8 1 (0.47%) Intrusion Detection
Database & Business Intelligence
1 21 (9.86%) Power BI
2 17 (7.98%) Data Lake
3 14 (6.57%) SQL Server
4 9 (4.23%) Tableau
5 5 (2.35%) Data Mining
5 5 (2.35%) RDBMS
5 5 (2.35%) Relational Database
6 3 (1.41%) Apache Ignite
6 3 (1.41%) Data Warehouse
6 3 (1.41%) Elasticsearch
6 3 (1.41%) Hadoop
6 3 (1.41%) Oracle Reports
7 2 (0.94%) MongoDB
7 2 (0.94%) NoSQL
7 2 (0.94%) PostgreSQL
7 2 (0.94%) SQL Server Analysis Services
7 2 (0.94%) SQL Server Integration Services
7 2 (0.94%) SQL Server Reporting Services
8 1 (0.47%) Electronic Patient Records
Development Applications
1 4 (1.88%) Atlassian Bamboo
1 4 (1.88%) JIRA
2 2 (0.94%) Bitbucket
2 2 (0.94%) Jenkins
2 2 (0.94%) Spinnaker
2 2 (0.94%) YouTrack
General
1 103 (48.36%) Finance
2 67 (31.46%) Analytical Skills
3 64 (30.05%) Social Skills
4 44 (20.66%) Law
5 31 (14.55%) Games
6 29 (13.62%) Marketing
7 23 (10.80%) Banking
8 18 (8.45%) French Language
9 17 (7.98%) Pharmaceutical
10 13 (6.10%) Dutch Language
11 12 (5.63%) Inclusion and Diversity
11 12 (5.63%) Presentation Skills
11 12 (5.63%) Retail
12 11 (5.16%) Legal
13 8 (3.76%) Public Sector
14 6 (2.82%) Influencing Skills
15 5 (2.35%) Manufacturing
15 5 (2.35%) Organisational Skills
16 3 (1.41%) Billing
16 3 (1.41%) Local Government
Job Titles
1 56 (26.29%) Architect
2 36 (16.90%) Senior
3 33 (15.49%) IT Manager
4 28 (13.15%) Lead
5 26 (12.21%) Senior Architect
6 23 (10.80%) IT Architect
7 22 (10.33%) Solutions Architect
8 16 (7.51%) Head of IT
9 15 (7.04%) Delivery Manager
10 13 (6.10%) Consultant
11 12 (5.63%) Lead Architect
12 11 (5.16%) Analyst
12 11 (5.16%) CRM Architect
12 11 (5.16%) Salesforce Architect
13 10 (4.69%) Senior Solutions Architect
14 8 (3.76%) IT Consultant
14 8 (3.76%) Senior Salesforce Architect
15 6 (2.82%) Head of Architecture
15 6 (2.82%) Lead Solutions Architect
15 6 (2.82%) Technology Risk Manager
Libraries, Frameworks & Software Standards
1 7 (3.29%) HTML
2 6 (2.82%) CSS
3 4 (1.88%) Middleware
4 3 (1.41%) Kafka
4 3 (1.41%) Oracle Fusion
4 3 (1.41%) Spring
4 3 (1.41%) Spring Boot
5 2 (0.94%) .NET
5 2 (0.94%) Django
5 2 (0.94%) Flask
5 2 (0.94%) React
5 2 (0.94%) Spring Batch
6 1 (0.47%) 802.1X
6 1 (0.47%) FHIR
6 1 (0.47%) Micronaut
6 1 (0.47%) OAuth
6 1 (0.47%) OAuth2
6 1 (0.47%) OpenID
6 1 (0.47%) Quarkus
6 1 (0.47%) RESTful
Miscellaneous
1 33 (15.49%) Enterprise Software
2 22 (10.33%) Cloud Native
3 11 (5.16%) Analytical Mindset
3 11 (5.16%) Product Ownership
4 9 (4.23%) Blockchain
5 8 (3.76%) Low-Code
6 7 (3.29%) Public Cloud
7 6 (2.82%) Hybrid Cloud
7 6 (2.82%) Learning Management System
7 6 (2.82%) Management Information System
8 5 (2.35%) IoT
8 5 (2.35%) Microsoft Licensing
9 4 (1.88%) Onboarding
9 4 (1.88%) Swaptions
9 4 (1.88%) Tandem
9 4 (1.88%) Virtual Team
10 3 (1.41%) Data Centre
10 3 (1.41%) Marketing Technology
10 3 (1.41%) PKI
10 3 (1.41%) Reinsurance
Operating Systems
1 26 (12.21%) Windows
2 7 (3.29%) Windows Server
3 4 (1.88%) Linux
4 2 (0.94%) Mac OS
4 2 (0.94%) Windows Server 2016
4 2 (0.94%) Windows Server 2019
Processes & Methodologies
1 108 (50.70%) Technology Strategy
2 72 (33.80%) Roadmaps
3 71 (33.33%) Cybersecurity
4 70 (32.86%) Agile
5 61 (28.64%) Project Management
6 54 (25.35%) Risk Management
7 53 (24.88%) Business Strategy
8 51 (23.94%) Problem-Solving
9 46 (21.60%) Analytics
10 40 (18.78%) Service Management
11 38 (17.84%) CRM
12 36 (16.90%) Decision-Making
13 35 (16.43%) Project Delivery
13 35 (16.43%) Technical Leadership
14 33 (15.49%) Data Security
15 32 (15.02%) Continuous Improvement
16 31 (14.55%) DevOps
17 30 (14.08%) Microservices
17 30 (14.08%) Stakeholder Management
18 28 (13.15%) Mathematics
Programming Languages
1 12 (5.63%) Java
2 11 (5.16%) SQL
3 9 (4.23%) JavaScript
4 8 (3.76%) PowerShell
5 7 (3.29%) Python
5 7 (3.29%) R
6 4 (1.88%) VB
7 2 (0.94%) TypeScript
8 1 (0.47%) C
8 1 (0.47%) C#
Qualifications
1 54 (25.35%) Degree
2 10 (4.69%) PMI Certification
3 9 (4.23%) PMP
4 6 (2.82%) CISA
5 5 (2.35%) PRINCE2 Practitioner
6 4 (1.88%) ITIL Certification
7 3 (1.41%) (ISC)2 CCSP
7 3 (1.41%) Azure Certification
7 3 (1.41%) CCSK
7 3 (1.41%) CCSP
7 3 (1.41%) CFA
7 3 (1.41%) Cisco Certification
7 3 (1.41%) CISM
7 3 (1.41%) Computer Science Degree
7 3 (1.41%) Master's Degree
7 3 (1.41%) Security Cleared
8 2 (0.94%) AWS Certification
8 2 (0.94%) CISSP
8 2 (0.94%) SC Cleared
8 2 (0.94%) TOGAF Certification
Quality Assurance & Compliance
1 22 (10.33%) GxP
2 21 (9.86%) GDPR
3 8 (3.76%) Cyber Essentials
4 6 (2.82%) Data Quality
4 6 (2.82%) NIST
4 6 (2.82%) QA
5 5 (2.35%) HIPAA
5 5 (2.35%) PMO
6 3 (1.41%) Cyber Essentials PLUS
6 3 (1.41%) ISO/IEC 27001
6 3 (1.41%) Sarbanes-Oxley
7 1 (0.47%) Accessibility
7 1 (0.47%) DICOM
7 1 (0.47%) GRC
7 1 (0.47%) HL7
7 1 (0.47%) NIST 800
7 1 (0.47%) SNOMED CT
System Software
1 18 (8.45%) Active Directory
2 10 (4.69%) VMware Infrastructure
3 5 (2.35%) Hyper-V
4 3 (1.41%) VMware ESXi
5 2 (0.94%) Firmware
5 2 (0.94%) Virtual Desktop
6 1 (0.47%) Forefront TMG
6 1 (0.47%) ISA Server
Systems Management
1 6 (2.82%) Microsoft Intune
2 5 (2.35%) Terraform
3 3 (1.41%) Ansible
3 3 (1.41%) Puppet
3 3 (1.41%) SCCM
3 3 (1.41%) Single Sign-On
3 3 (1.41%) vCenter Server
4 2 (0.94%) Salt
4 2 (0.94%) VxRail
4 2 (0.94%) WSUS
5 1 (0.47%) Computer Emergency Response Teams
5 1 (0.47%) Jamf Pro
5 1 (0.47%) Kubernetes
5 1 (0.47%) Progress Chef
Vendors
1 68 (31.92%) Microsoft
2 22 (10.33%) Google
2 22 (10.33%) Oracle
3 21 (9.86%) SAP
4 19 (8.92%) VMware
5 18 (8.45%) Salesforce
6 17 (7.98%) Dell
7 13 (6.10%) Adobe
8 11 (5.16%) MuleSoft
9 10 (4.69%) ServiceNow
10 8 (3.76%) HubSpot
11 6 (2.82%) Cisco
12 4 (1.88%) OpenLink
12 4 (1.88%) Sybase
12 4 (1.88%) TIBCO
13 3 (1.41%) Citrix
13 3 (1.41%) Facebook
13 3 (1.41%) Fortinet
13 3 (1.41%) Murex
13 3 (1.41%) Zoho