Analytical Skills Jobs in the South East

Analytical Skills
England > South East

The table below looks at the prevalence of the term Analytical Skills in permanent job vacancies in the South East. Included is a benchmarking guide to the salaries offered in vacancies that cited Analytical Skills over the 6 months leading up to 5 June 2025, comparing them to the same period in the previous two years.

6 months to
5 Jun 2025
Same period 2024 Same period 2023
Rank 26 12 23
Rank change year-on-year -14 +11 +6
Permanent jobs citing Analytical Skills 727 1,780 1,112
As % of all permanent jobs advertised in the South East 7.51% 9.90% 8.18%
As % of the General category 11.00% 17.81% 12.96%
Number of salaries quoted 297 876 536
10th Percentile £30,000 £29,000 £29,250
25th Percentile £38,750 £36,250 £36,250
Median annual salary (50th Percentile) £52,500 £49,000 £48,687
Median % change year-on-year +7.14% +0.64% -7.26%
75th Percentile £63,750 £62,500 £62,000
90th Percentile £76,250 £73,750 £77,500
England median annual salary £55,000 £50,000 £55,000
% change year-on-year +10.00% -9.09% -

All General Skills
South East

Analytical Skills falls under the General Skills category. For comparison with the information above, the following table provides summary statistics for all permanent job vacancies requiring common skills in the South East.

Permanent vacancies with a requirement for common skills 6,609 9,992 8,579
As % of all permanent jobs advertised in the South East 68.25% 55.57% 63.09%
Number of salaries quoted 2,789 6,196 4,288
10th Percentile £27,500 £25,750 £28,750
25th Percentile £37,250 £32,500 £37,500
Median annual salary (50th Percentile) £55,000 £47,500 £52,500
Median % change year-on-year +15.79% -9.52% -2.78%
75th Percentile £70,000 £62,500 £70,000
90th Percentile £77,500 £75,000 £85,000
England median annual salary £55,000 £52,500 £60,000
% change year-on-year +4.76% -12.50% -

Analytical Skills
Job Vacancy Trend in the South East

Job postings citing Analytical Skills as a proportion of all IT jobs advertised in the South East.
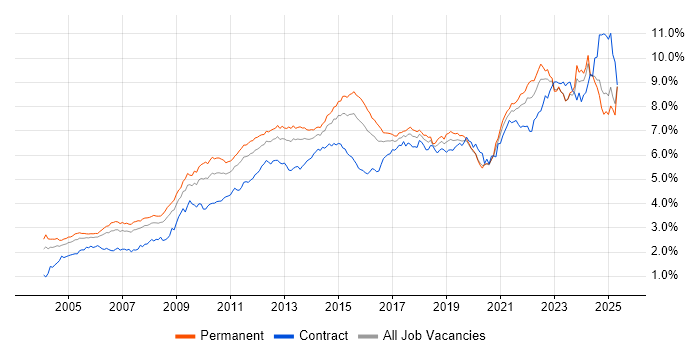
Job vacancy trend for Analytical Skills in the South East

Analytical Skills
Salary Trend in the South East

3-month moving average salary quoted in jobs citing Analytical Skills in the South East.

Salary trend for Analytical Skills in the South East

Analytical Skills
Salary Histogram in the South East

Salary distribution for jobs citing Analytical Skills in the South East over the 6 months to 5 June 2025.

Salary histogram for Analytical Skills in the South East

Analytical Skills
Job Locations in the South East

The table below looks at the demand and provides a guide to the median salaries quoted in IT jobs citing Analytical Skills within the South East region over the 6 months to 5 June 2025. The 'Rank Change' column provides an indication of the change in demand within each location based on the same 6 month period last year.

Location Rank Change
on Same Period
Last Year
Matching
Permanent
IT Job Ads
Median Salary
Past 6 Months
Median Salary
% Change
on Same Period
Last Year
Live
Jobs
Thames Valley -6 369 £52,500 +10.53% 1,460
Berkshire +1 234 £65,000 +36.84% 942
Hampshire +10 120 £50,000 -4.76% 522
Buckinghamshire -17 104 £50,967 +15.03% 316
Surrey -18 99 £55,000 +10.00% 314
Kent -11 41 £42,500 +14.86% 292
Middlesex -14 40 £60,000 +87.50% 22
Oxfordshire -35 31 £42,598 -18.86% 210
West Sussex +6 23 £55,000 -1.79% 186
East Sussex -5 19 £60,000 +26.32% 151
Isle of Wight - 12 £60,000 - 1
Analytical Skills
England

Analytical Skills
Co-occurring Skills and Capabilities in the South East by Category

The follow tables expand on the table above by listing co-occurrences grouped by category. The same employment type, locality and period is covered with up to 20 co-occurrences shown in each of the following categories:

Application Platforms
1 24 (3.30%) CMS
2 15 (2.06%) Oracle Application Server
3 13 (1.79%) SharePoint
4 8 (1.10%) Apache Spark
5 7 (0.96%) Microsoft Exchange
6 4 (0.55%) Apache
7 3 (0.41%) Confluence
8 2 (0.28%) Skype for Business
8 2 (0.28%) Umbraco
9 1 (0.14%) IBM Domino
9 1 (0.14%) Oracle Workflow
Applications
1 41 (5.64%) Microsoft Excel
2 40 (5.50%) Chatbot
3 26 (3.58%) Microsoft Office
4 7 (0.96%) Microsoft Project
5 6 (0.83%) Spreadsheet
6 4 (0.55%) Microsoft PowerPoint
7 1 (0.14%) AutoCAD
7 1 (0.14%) MicroStation
7 1 (0.14%) MS Visio
7 1 (0.14%) Simulink
Business Applications
1 15 (2.06%) Shopify
2 8 (1.10%) Infor LN
2 8 (1.10%) SAP BPC
3 5 (0.69%) Dynamics CRM
3 5 (0.69%) Dynamics GP
4 2 (0.28%) Oracle Assets
4 2 (0.28%) Oracle EBS
4 2 (0.28%) Oracle EBS R12
4 2 (0.28%) Oracle Payables
4 2 (0.28%) Oracle Receivables
4 2 (0.28%) SAP S/4HANA
5 1 (0.14%) Dynamics AX
5 1 (0.14%) Maximo
5 1 (0.14%) NetSuite
5 1 (0.14%) Payment Gateway
5 1 (0.14%) SAP GRC
Cloud Services
1 164 (22.56%) Azure
2 73 (10.04%) AWS
3 58 (7.98%) Power Platform
4 50 (6.88%) GCP
5 48 (6.60%) SaaS
6 31 (4.26%) Serverless
7 27 (3.71%) AWS Lambda
8 23 (3.16%) Azure Data Factory
9 22 (3.03%) Microsoft 365
10 20 (2.75%) Google Analytics
11 19 (2.61%) PaaS
12 18 (2.48%) Amazon EKS
12 18 (2.48%) AWS CloudFormation
12 18 (2.48%) iPaaS
13 17 (2.34%) Vertex AI
14 14 (1.93%) Azure Synapse Analytics
14 14 (1.93%) Google Ads
14 14 (1.93%) Salsify
15 10 (1.38%) Google Tag Manager
16 9 (1.24%) Dynamics 365
Communications & Networking
1 27 (3.71%) Broadband
2 21 (2.89%) Firewall
3 19 (2.61%) VPN
4 16 (2.20%) TCP/IP
5 13 (1.79%) DNS
6 10 (1.38%) LAN
6 10 (1.38%) WAN
7 9 (1.24%) Internet
8 8 (1.10%) DHCP
9 3 (0.41%) Cisco IOS
9 3 (0.41%) IPsec
9 3 (0.41%) MPLS
9 3 (0.41%) VLAN
9 3 (0.41%) VoIP
10 2 (0.28%) BGP
10 2 (0.28%) Junos
10 2 (0.28%) Wireless
10 2 (0.28%) Wireshark
11 1 (0.14%) 4G
11 1 (0.14%) Modbus
Database & Business Intelligence
1 50 (6.88%) Power BI
2 43 (5.91%) Data Lake
3 29 (3.99%) Data Warehouse
4 27 (3.71%) SQL Server
5 25 (3.44%) Data Mining
6 24 (3.30%) Tableau
7 21 (2.89%) Big Data
8 18 (2.48%) Elasticsearch
8 18 (2.48%) Metadata
9 16 (2.20%) Oracle Reports
10 15 (2.06%) Enterprise Data Warehouse
10 15 (2.06%) SQL Server Reporting Services
11 11 (1.51%) SQL Server Integration Services
12 9 (1.24%) OLTP
13 8 (1.10%) MySQL
13 8 (1.10%) PostgreSQL
14 6 (0.83%) Hadoop
14 6 (0.83%) Relational Database
15 5 (0.69%) MongoDB
15 5 (0.69%) SQLite
Development Applications
1 12 (1.65%) Jenkins
2 8 (1.10%) Git
2 8 (1.10%) JIRA
2 8 (1.10%) Oracle Forms
3 5 (0.69%) GitLab
3 5 (0.69%) JUnit
3 5 (0.69%) Mockito
4 3 (0.41%) Visual Studio
5 2 (0.28%) Bitbucket Server
5 2 (0.28%) DbUnit
5 2 (0.28%) jMock
5 2 (0.28%) Maven
5 2 (0.28%) MLflow
5 2 (0.28%) Selenium
5 2 (0.28%) SonarQube
6 1 (0.14%) ERwin
6 1 (0.14%) JMeter
6 1 (0.14%) Octopus Deploy
General
1 401 (55.16%) Social Skills
2 172 (23.66%) Finance
3 134 (18.43%) Law
4 121 (16.64%) Marketing
5 86 (11.83%) Retail
6 75 (10.32%) Influencing Skills
7 62 (8.53%) Legal
8 47 (6.46%) Inclusion and Diversity
9 41 (5.64%) Organisational Skills
10 35 (4.81%) Manufacturing
10 35 (4.81%) Presentation Skills
11 30 (4.13%) Advertising
12 27 (3.71%) Electronics
13 19 (2.61%) Automotive
14 17 (2.34%) Banking
14 17 (2.34%) Telecoms
15 15 (2.06%) Military
15 15 (2.06%) Public Sector
16 13 (1.79%) Pharmaceutical
17 8 (1.10%) Police
Job Titles
1 198 (27.24%) Senior
2 114 (15.68%) Analyst
3 85 (11.69%) Lead
4 61 (8.39%) Developer
5 56 (7.70%) Trainer
6 41 (5.64%) Senior Manager
7 39 (5.36%) Architect
8 26 (3.58%) Business Change Analyst
8 26 (3.58%) Change Analyst
9 25 (3.44%) Machine Learning Engineer
10 23 (3.16%) Support Analyst
11 21 (2.89%) Product Manager
12 20 (2.75%) Senior Electrical Engineer
13 18 (2.48%) Software Developer
14 17 (2.34%) Applications Architect
14 17 (2.34%) IT Architect
14 17 (2.34%) IT Manager
15 15 (2.06%) Account Manager
15 15 (2.06%) Senior Account Manager
16 14 (1.93%) Marketing Manager
Libraries, Frameworks & Software Standards
1 26 (3.58%) .NET
2 25 (3.44%) Node.js
3 23 (3.16%) Pandas
4 17 (2.34%) HTML
5 12 (1.65%) React
6 11 (1.51%) JSON
6 11 (1.51%) Vue
7 8 (1.10%) CSS
7 8 (1.10%) REST
8 7 (0.96%) AngularJS
8 7 (0.96%) Kafka
9 6 (0.83%) Flutter
9 6 (0.83%) Laravel
9 6 (0.83%) RESTful
9 6 (0.83%) Spring
9 6 (0.83%) Spring Boot
9 6 (0.83%) XML
10 5 (0.69%) Hibernate
11 4 (0.55%) PySpark
11 4 (0.55%) SOAP
Miscellaneous
1 81 (11.14%) Analytical Mindset
2 52 (7.15%) Self-Motivation
3 40 (5.50%) Algorithms
4 35 (4.81%) Management Information System
5 19 (2.61%) Cyberattack
6 18 (2.48%) Greenfield Project
7 17 (2.34%) Digital Media
7 17 (2.34%) Marketing Technology
8 16 (2.20%) Robotics
8 16 (2.20%) Security Posture
9 14 (1.93%) Taxonomies
10 13 (1.79%) Social Media
11 9 (1.24%) Onboarding
11 9 (1.24%) Security Operations Centre
12 8 (1.10%) Cyber Threat
13 7 (0.96%) Blog
13 7 (0.96%) Virtual Team
14 6 (0.83%) Mobile App
14 6 (0.83%) Product Ownership
15 5 (0.69%) Renewable Energy
Operating Systems
1 27 (3.71%) Linux
2 22 (3.03%) Windows
3 19 (2.61%) Android
4 4 (0.55%) Mac OS
4 4 (0.55%) Unix
5 3 (0.41%) Windows 10
6 2 (0.28%) Windows Server
7 1 (0.14%) Apple iOS
7 1 (0.14%) Mac OS X
Processes & Methodologies
1 410 (56.40%) Problem-Solving
2 236 (32.46%) Agile
3 173 (23.80%) Analytics
4 129 (17.74%) Artificial Intelligence
5 112 (15.41%) Decision-Making
5 112 (15.41%) Machine Learning
6 110 (15.13%) Roadmaps
7 107 (14.72%) Strategic Thinking
8 105 (14.44%) Continuous Improvement
9 101 (13.89%) Data Science
10 90 (12.38%) Project Management
11 82 (11.28%) Actionable Insight
12 80 (11.00%) Collaborative Working
13 79 (10.87%) Mentoring
14 72 (9.90%) DevOps
15 71 (9.77%) Change Management
16 68 (9.35%) Process Improvement
17 66 (9.08%) Business Intelligence
18 62 (8.53%) Strategic Roadmap
19 61 (8.39%) Stakeholder Engagement
Programming Languages
1 88 (12.10%) SQL
2 83 (11.42%) Python
3 50 (6.88%) Java
4 37 (5.09%) JavaScript
5 29 (3.99%) C++
6 27 (3.71%) TypeScript
7 18 (2.48%) Go
7 18 (2.48%) Rust
8 12 (1.65%) C#
9 10 (1.38%) PL/SQL
9 10 (1.38%) PowerShell
10 7 (0.96%) Kotlin
11 6 (0.83%) Bash
11 6 (0.83%) Kusto Query Language
11 6 (0.83%) PHP
12 5 (0.69%) R
12 5 (0.69%) T-SQL
13 4 (0.55%) Data Analysis Expressions
13 4 (0.55%) MATLAB
14 3 (0.41%) X++
Qualifications
1 229 (31.50%) Degree
2 88 (12.10%) Master's Degree
3 66 (9.08%) PhD
4 46 (6.33%) Security Cleared
5 35 (4.81%) Computer Science Degree
6 33 (4.54%) BPSS Clearance
7 28 (3.85%) CBAP
8 26 (3.58%) DBS Check
9 25 (3.44%) DV Cleared
10 22 (3.03%) PMI Certification
11 21 (2.89%) PMP
11 21 (2.89%) SC Cleared
12 15 (2.06%) ACCA
12 15 (2.06%) CIMA
13 12 (1.65%) Microsoft Certification
14 11 (1.51%) Azure Certification
15 10 (1.38%) CISSP
16 8 (1.10%) OSCP
17 7 (0.96%) Network+ Certification
18 6 (0.83%) CISM
Quality Assurance & Compliance
1 30 (4.13%) Data Quality
2 26 (3.58%) ISO/IEC 27001
3 22 (3.03%) GDPR
4 18 (2.48%) QA
5 15 (2.06%) SLA
6 12 (1.65%) Accessibility
7 9 (1.24%) Cyber Essentials
8 8 (1.10%) Cyber Essentials PLUS
8 8 (1.10%) GAAP
8 8 (1.10%) GRC
8 8 (1.10%) IFRS
9 6 (0.83%) NIST
10 5 (0.69%) HIPAA
10 5 (0.69%) Sarbanes-Oxley
11 3 (0.41%) 21 CFR Part 11
11 3 (0.41%) Good Clinical Practice
12 2 (0.28%) Actionable Recommendations
12 2 (0.28%) PMO
12 2 (0.28%) SOC 2
13 1 (0.14%) AQAP
System Software
1 29 (3.99%) Docker
2 12 (1.65%) Active Directory
3 5 (0.69%) HDFS
3 5 (0.69%) Virtual Machines
4 1 (0.14%) Postfix
Systems Management
1 27 (3.71%) Kubernetes
2 23 (3.16%) Terraform
3 18 (2.48%) Ansible
4 4 (0.55%) QRadar
5 2 (0.28%) Grafana
5 2 (0.28%) Hadoop YARN
5 2 (0.28%) Kubeflow
5 2 (0.28%) Prometheus
5 2 (0.28%) RSA Archer
6 1 (0.14%) Argo
6 1 (0.14%) Dell DRAC
6 1 (0.14%) Nessus
6 1 (0.14%) SCCM
6 1 (0.14%) Single Sign-On
Vendors
1 127 (17.47%) Microsoft
2 68 (9.35%) Google
3 40 (5.50%) PayPal
4 38 (5.23%) SAP
5 37 (5.09%) Oracle
6 32 (4.40%) Databricks
7 19 (2.61%) Concur
7 19 (2.61%) Workday
8 17 (2.34%) Adobe
9 15 (2.06%) OpenAI
10 13 (1.79%) ServiceNow
11 12 (1.65%) Splunk
12 11 (1.51%) Infor
13 9 (1.24%) Cisco
13 9 (1.24%) Informatica
13 9 (1.24%) Pinterest
13 9 (1.24%) TikTok
14 8 (1.10%) Cognos
14 8 (1.10%) Salesforce
15 4 (0.55%) Instagram