Lead Jobs in the South East

Leader
England > South East

The median Leader salary in the South East is £67,500 per year, according to job vacancies posted during the 6 months leading to 12 May 2025.

The table below provides salary benchmarking and summary statistics, comparing them to the same period in the previous two years.

6 months to
12 May 2025
Same period 2024 Same period 2023
Rank 24 27 43
Rank change year-on-year +3 +16 +2
Permanent jobs requiring a Lead 734 1,174 887
As % of all permanent jobs advertised in the South East 7.81% 6.98% 6.13%
As % of the Job Titles category 9.02% 7.43% 6.79%
Number of salaries quoted 318 861 670
10th Percentile £45,125 £36,250 £45,000
25th Percentile £57,670 £47,500 £53,750
Median annual salary (50th Percentile) £67,500 £62,500 £65,500
Median % change year-on-year +8.00% -4.58% -
75th Percentile £80,000 £80,000 £78,750
90th Percentile £93,250 £95,000 £95,000
England median annual salary £72,500 £70,000 £75,000
% change year-on-year +3.57% -6.67% -

All Permanent IT Job Vacancies
South East

For comparison with the information above, the following table provides summary statistics for all permanent IT job vacancies in the South East. Most job vacancies include a discernible job title that can be normalized. As such, the figures in the second row provide an indication of the number of permanent jobs in our overall sample.

Permanent vacancies in the South East with a recognized job title 8,134 15,805 13,069
% of permanent jobs with a recognized job title 86.58% 93.97% 90.36%
Number of salaries quoted 4,548 11,356 8,239
10th Percentile £30,000 £27,500 £29,750
25th Percentile £41,250 £36,032 £40,000
Median annual salary (50th Percentile) £55,000 £50,000 £55,000
Median % change year-on-year +10.00% -9.09% -
75th Percentile £68,750 £65,000 £71,250
90th Percentile £78,750 £77,500 £85,000
England median annual salary £57,500 £53,500 £60,800
% change year-on-year +7.48% -12.01% +1.33%

Lead
Job Vacancy Trend in the South East

Job postings that featured Lead in the job title as a proportion of all IT jobs advertised in the South East.
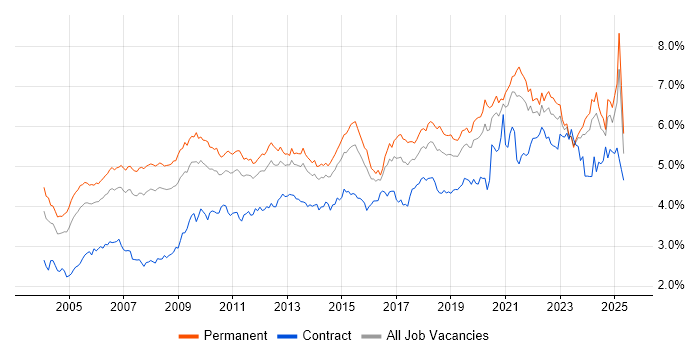
Job vacancy trend for Lead in the South East

Lead
Salary Trend in the South East

3-month moving average salary quoted in jobs citing Lead in the South East.

Salary trend for Lead in the South East

Lead
Salary Histogram in the South East

Salary distribution for jobs citing Lead in the South East over the 6 months to 12 May 2025.

Salary histogram for Lead in the South East

Lead
Job Locations in the South East

The table below looks at the demand and provides a guide to the median salaries quoted in IT jobs citing Lead within the South East region over the 6 months to 12 May 2025. The 'Rank Change' column provides an indication of the change in demand within each location based on the same 6 month period last year.

Location Rank Change
on Same Period
Last Year
Matching
Permanent
IT Job Ads
Median Salary
Past 6 Months
Median Salary
% Change
on Same Period
Last Year
Live
Jobs
Thames Valley +11 379 £75,000 +20.32% 120
Berkshire +20 303 £82,500 +10.00% 69
Hampshire -26 97 £60,000 - 85
Surrey +14 92 £75,000 +25.00% 67
Isle of Wight - 66 £75,000 - 12
Buckinghamshire -19 49 £70,000 +16.67% 37
Middlesex +1 38 £60,000 +34.36% 19
East Sussex +17 27 £72,750 -9.06% 12
Kent -10 27 £65,000 +30.00% 37
Oxfordshire -19 27 £70,000 +33.33% 25
West Sussex +7 6 £66,250 +3.52% 16
Sussex +9 3 £66,500 +66.25% 9
Lead
England

Lead Skill Set
Top 30 Co-occurring Skills and Capabilities in the South East

For the 6 months to 12 May 2025, Lead job roles required the following skills and capabilities in order of popularity. The figures indicate the absolute number co-occurrences and as a proportion of all permanent job ads across the South East region featuring Lead in the job title.

1 268 (36.51%) Degree
2 251 (34.20%) Law
3 230 (31.34%) Social Skills
4 220 (29.97%) Problem-Solving
5 182 (24.80%) Roadmaps
6 174 (23.71%) Azure
7 173 (23.57%) Analytics
8 161 (21.93%) Agile
9 160 (21.80%) Microsoft
10 155 (21.12%) Product Management
11 151 (20.57%) Computer Science
12 130 (17.71%) Mentoring
13 113 (15.40%) Stakeholder Management
13 113 (15.40%) Continuous Improvement
14 110 (14.99%) DevOps
15 108 (14.71%) Business Intelligence
16 102 (13.90%) Data Management
17 100 (13.62%) Business Transformation
18 99 (13.49%) Python
19 97 (13.22%) Data Modelling
20 96 (13.08%) SAP
20 96 (13.08%) Data Architecture
20 96 (13.08%) Data Engineering
21 93 (12.67%) Finance
22 90 (12.26%) AWS
23 89 (12.13%) Analytical Skills
24 87 (11.85%) Data Governance
24 87 (11.85%) Project Management
25 84 (11.44%) BPSS Clearance
26 82 (11.17%) Data Analysis

Lead Skill Set
Co-occurring Skills and Capabilities in the South East by Category

The follow tables expand on the table above by listing co-occurrences grouped by category. The same employment type, locality and period is covered with up to 20 co-occurrences shown in each of the following categories:

Application Platforms
1 27 (3.68%) SharePoint
2 6 (0.82%) Apache
2 6 (0.82%) IIS
3 5 (0.68%) Apache Spark
3 5 (0.68%) IBM Domino
4 4 (0.54%) Apache Airflow
5 3 (0.41%) CMS
6 1 (0.14%) Apache Solr
6 1 (0.14%) Confluence
6 1 (0.14%) Microsoft Exchange
6 1 (0.14%) nginx
6 1 (0.14%) OpenStack
6 1 (0.14%) Oracle HTTP Server
6 1 (0.14%) Oracle Workflow
6 1 (0.14%) Tomcat
6 1 (0.14%) WebLogic
Applications
1 10 (1.36%) Microsoft Office
2 9 (1.23%) Microsoft Excel
3 4 (0.54%) Simulink
4 1 (0.14%) Adobe Creative Suite
4 1 (0.14%) Chatbot
4 1 (0.14%) Microsoft PowerPoint
4 1 (0.14%) Microsoft Project
4 1 (0.14%) OrCAD
4 1 (0.14%) Photoshop
4 1 (0.14%) Spreadsheet
4 1 (0.14%) Trello
Business Applications
1 8 (1.09%) Infor LN
1 8 (1.09%) SAP BPC
2 4 (0.54%) SAP S/4HANA
3 3 (0.41%) Oracle EBS
4 2 (0.27%) Oracle EBS R12
4 2 (0.27%) Oracle ERP
4 2 (0.27%) Oracle Financials
4 2 (0.27%) SAP Business One
4 2 (0.27%) SAP PP
5 1 (0.14%) Dynamics CRM
5 1 (0.14%) Oracle Payables
5 1 (0.14%) SAP GRC
5 1 (0.14%) SAP IBP
Cloud Services
1 174 (23.71%) Azure
2 90 (12.26%) AWS
3 41 (5.59%) GCP
4 40 (5.45%) Power Platform
5 29 (3.95%) Snowflake
6 28 (3.81%) Microsoft 365
6 28 (3.81%) SaaS
7 26 (3.54%) Power Automate
7 26 (3.54%) PowerApps
8 25 (3.41%) Pulumi
9 19 (2.59%) Azure DevOps
10 15 (2.04%) Vertex AI
11 14 (1.91%) PaaS
12 12 (1.63%) Azure Data Factory
12 12 (1.63%) Azure Synapse Analytics
13 5 (0.68%) Cloud Computing
13 5 (0.68%) Collibra
13 5 (0.68%) Figma
13 5 (0.68%) Microsoft Purview
14 4 (0.54%) Amazon SQS
Communications & Networking
1 61 (8.31%) Broadband
2 19 (2.59%) Firewall
3 13 (1.77%) LAN
3 13 (1.77%) TCP/IP
3 13 (1.77%) WAN
3 13 (1.77%) Wi-Fi
4 10 (1.36%) Network Security
5 9 (1.23%) 5G
5 9 (1.23%) Bluetooth
5 9 (1.23%) LTE
5 9 (1.23%) VPN
6 7 (0.95%) Intrusion Detection
6 7 (0.95%) MPLS
6 7 (0.95%) SD-WAN
7 5 (0.68%) BGP
7 5 (0.68%) OSPF
7 5 (0.68%) VLAN
8 3 (0.41%) DNS
8 3 (0.41%) NAS
9 2 (0.27%) Remote Desktop
Database & Business Intelligence
1 62 (8.45%) Data Lake
2 40 (5.45%) Power BI
3 38 (5.18%) NoSQL
4 35 (4.77%) Data Warehouse
5 34 (4.63%) Tableau
6 27 (3.68%) Big Data
7 25 (3.41%) RDBMS
7 25 (3.41%) Relational Database
8 24 (3.27%) Data Mining
8 24 (3.27%) Metadata
9 14 (1.91%) SQL Server
10 8 (1.09%) MongoDB
10 8 (1.09%) SQL Server Reporting Services
11 5 (0.68%) Hadoop
11 5 (0.68%) PostgreSQL
12 4 (0.54%) Apache Hudi
12 4 (0.54%) Apache Iceberg
12 4 (0.54%) Delta Lake
12 4 (0.54%) MySQL
13 3 (0.41%) Amazon Aurora
Development Applications
1 25 (3.41%) Jaeger
2 14 (1.91%) Git
3 11 (1.50%) JIRA
4 9 (1.23%) Oracle Forms
4 9 (1.23%) Selenium
5 7 (0.95%) Cypress.io
5 7 (0.95%) SoapUI
6 5 (0.68%) Jenkins
7 4 (0.54%) Bitbucket
7 4 (0.54%) Rational DOORS
8 3 (0.41%) GitLab
8 3 (0.41%) JUnit
8 3 (0.41%) Maven
8 3 (0.41%) Mockito
8 3 (0.41%) SonarQube
9 2 (0.27%) Bitbucket Server
9 2 (0.27%) DbUnit
9 2 (0.27%) jMock
9 2 (0.27%) Subversion
9 2 (0.27%) Visual Studio
General
1 251 (34.20%) Law
2 230 (31.34%) Social Skills
3 93 (12.67%) Finance
4 89 (12.13%) Analytical Skills
5 57 (7.77%) Inclusion and Diversity
6 40 (5.45%) Electronics
6 40 (5.45%) Retail
7 21 (2.86%) Legal
8 19 (2.59%) Marketing
9 18 (2.45%) Influencing Skills
10 14 (1.91%) Multimedia
11 12 (1.63%) Manufacturing
12 10 (1.36%) Aerospace
13 9 (1.23%) Tech for Good
14 8 (1.09%) Aviation
14 8 (1.09%) Police
14 8 (1.09%) Public Sector
15 7 (0.95%) Games
16 6 (0.82%) Banking
16 6 (0.82%) Publishing
Libraries, Frameworks & Software Standards
1 38 (5.18%) React
2 28 (3.81%) .NET
3 26 (3.54%) Elastic Stack
4 25 (3.41%) OpenTelemetry
5 18 (2.45%) Kafka
6 15 (2.04%) AngularJS
7 13 (1.77%) HTML
7 13 (1.77%) REST
7 13 (1.77%) YAML
8 12 (1.63%) XML
9 11 (1.50%) CSS
10 7 (0.95%) .NET Core
10 7 (0.95%) Jest
11 6 (0.82%) .NET Framework
11 6 (0.82%) React Native
11 6 (0.82%) Redux
11 6 (0.82%) RESTful
12 5 (0.68%) GraphQL
12 5 (0.68%) SOAP
12 5 (0.68%) Spring Boot
Miscellaneous
1 38 (5.18%) Product Ownership
2 35 (4.77%) Algorithms
3 29 (3.95%) Management Information System
4 22 (3.00%) Enterprise Software
5 14 (1.91%) Security Posture
6 13 (1.77%) IoT
7 12 (1.63%) Embedded Systems
8 10 (1.36%) Cloud Native
8 10 (1.36%) Data Centre
9 9 (1.23%) NB-IoT
9 9 (1.23%) Social Media
10 8 (1.09%) Client/Server
10 8 (1.09%) Private Cloud
10 8 (1.09%) Robotics
11 4 (0.54%) Hybrid Cloud
12 3 (0.41%) Augmented Reality
12 3 (0.41%) Cyber Threat
12 3 (0.41%) Greenfield Project
12 3 (0.41%) Legacy Systems
12 3 (0.41%) Self-Motivation
Operating Systems
1 49 (6.68%) Linux
2 29 (3.95%) Unix
3 26 (3.54%) Windows
4 13 (1.77%) Windows Server
5 6 (0.82%) Android
5 6 (0.82%) Apple iOS
6 2 (0.27%) Red Hat Enterprise Linux
7 1 (0.14%) AIX
7 1 (0.14%) SUSE
7 1 (0.14%) Windows Server 2019
Processes & Methodologies
1 220 (29.97%) Problem-Solving
2 182 (24.80%) Roadmaps
3 173 (23.57%) Analytics
4 161 (21.93%) Agile
5 155 (21.12%) Product Management
6 151 (20.57%) Computer Science
7 130 (17.71%) Mentoring
8 113 (15.40%) Continuous Improvement
8 113 (15.40%) Stakeholder Management
9 110 (14.99%) DevOps
10 108 (14.71%) Business Intelligence
11 102 (13.90%) Data Management
12 100 (13.62%) Business Transformation
13 97 (13.22%) Data Modelling
14 96 (13.08%) Data Architecture
14 96 (13.08%) Data Engineering
15 87 (11.85%) Data Governance
15 87 (11.85%) Project Management
16 82 (11.17%) Data Analysis
17 81 (11.04%) Artificial Intelligence
Programming Languages
1 99 (13.49%) Python
2 72 (9.81%) Java
3 58 (7.90%) SQL
4 57 (7.77%) JavaScript
5 52 (7.08%) C#
6 36 (4.90%) Bash
6 36 (4.90%) MATLAB
7 29 (3.95%) Go
8 23 (3.13%) PowerShell
9 22 (3.00%) C
9 22 (3.00%) Rust
10 18 (2.45%) TypeScript
11 13 (1.77%) C++
12 12 (1.63%) Ada
13 6 (0.82%) ABAP
14 4 (0.54%) PHP
14 4 (0.54%) Scala
15 3 (0.41%) R
15 3 (0.41%) Ruby
16 1 (0.14%) Embedded C
Qualifications
1 268 (36.51%) Degree
2 84 (11.44%) BPSS Clearance
3 80 (10.90%) Computer Science Degree
4 30 (4.09%) AWS Certification
4 30 (4.09%) Security Cleared
5 24 (3.27%) Master's Degree
6 23 (3.13%) SC Cleared
7 20 (2.72%) PMI Certification
8 19 (2.59%) PMP
9 12 (1.63%) Chartered Engineer
10 9 (1.23%) CompTIA Security+
10 9 (1.23%) Network+ Certification
11 8 (1.09%) ACCA
11 8 (1.09%) CIMA
12 5 (0.68%) ITIL Certification
12 5 (0.68%) MBA
12 5 (0.68%) PhD
13 4 (0.54%) CISSP
13 4 (0.54%) DV Cleared
14 3 (0.41%) Microsoft Certification
Quality Assurance & Compliance
1 64 (8.72%) Data Quality
2 34 (4.63%) QA
3 32 (4.36%) Accessibility
4 26 (3.54%) ISO/IEC 27001
5 20 (2.72%) SLA
6 19 (2.59%) NIST
7 13 (1.77%) NCSC
7 13 (1.77%) Sarbanes-Oxley
8 8 (1.09%) GAAP
8 8 (1.09%) IFRS
9 7 (0.95%) Def Stans
9 7 (0.95%) GDPR
10 6 (0.82%) Cyber Essentials
10 6 (0.82%) Cyber Essentials PLUS
10 6 (0.82%) PCI DSS
11 3 (0.41%) GRC
11 3 (0.41%) PMO
12 2 (0.27%) HL7
12 2 (0.27%) SNOMED CT
13 1 (0.14%) RMADS
System Software
1 45 (6.13%) Docker
2 19 (2.59%) VMware Infrastructure
3 13 (1.77%) vSphere
4 8 (1.09%) Active Directory
4 8 (1.09%) Hyper-V
5 5 (0.68%) HDFS
6 2 (0.27%) Firmware
7 1 (0.14%) Postfix
7 1 (0.14%) Virtual Desktop
7 1 (0.14%) VMware ESXi
7 1 (0.14%) VMware NSX
Systems Management
1 52 (7.08%) Kubernetes
2 50 (6.81%) Terraform
3 46 (6.27%) Ansible
4 31 (4.22%) Prometheus
5 27 (3.68%) Argo
6 25 (3.41%) Kustomize
7 15 (2.04%) Puppet
8 6 (0.82%) ArcSight ESM
8 6 (0.82%) Grafana
8 6 (0.82%) QRadar
9 5 (0.68%) Progress Chef
10 3 (0.41%) EMC VPLEX
11 2 (0.27%) Kubeflow
11 2 (0.27%) RSA Archer
12 1 (0.14%) EMC NetWorker
12 1 (0.14%) WSUS
12 1 (0.14%) ZABBIX
Vendors
1 160 (21.80%) Microsoft
2 96 (13.08%) SAP
3 41 (5.59%) Google
4 33 (4.50%) VMware
5 31 (4.22%) ServiceNow
6 24 (3.27%) IBM
7 23 (3.13%) Oracle
8 20 (2.72%) Concur
9 19 (2.59%) Workday
10 18 (2.45%) Salesforce
11 17 (2.32%) Databricks
12 15 (2.04%) Cisco
12 15 (2.04%) OpenAI
13 9 (1.23%) Cognos
13 9 (1.23%) Dell
14 8 (1.09%) Infor
14 8 (1.09%) Informatica
15 6 (0.82%) Aruba
15 6 (0.82%) McAfee
15 6 (0.82%) NetApp