Machine Learning Jobs in the UK excluding London

Machine Learning (ML)
UK > UK excluding London

The table below provides summary statistics for permanent job vacancies advertised in the UK excluding London requiring Machine Learning skills. It includes a benchmarking guide to the annual salaries offered in vacancies that cited Machine Learning over the 6 months leading up to 30 May 2025, comparing them to the same period in the previous two years.

6 months to
30 May 2025
Same period 2024 Same period 2023
Rank 63 73 123
Rank change year-on-year +10 +50 -25
Permanent jobs citing Machine Learning 1,628 2,540 1,651
As % of all permanent jobs advertised in the UK excluding London 4.13% 3.41% 2.85%
As % of the Processes & Methodologies category 4.46% 4.14% 2.98%
Number of salaries quoted 259 929 728
10th Percentile £41,100 £40,000 £42,500
25th Percentile £47,500 £45,000 £50,000
Median annual salary (50th Percentile) £65,000 £60,000 £65,000
Median % change year-on-year +8.33% -7.69% +8.33%
75th Percentile £82,500 £85,000 £77,715
90th Percentile £97,528 £97,500 £95,000
UK median annual salary £77,000 £70,000 £70,000
% change year-on-year +10.00% - -4.56%

All Process and Methodology Skills
UK excluding London

Machine Learning falls under the Processes and Methodologies category. For comparison with the information above, the following table provides summary statistics for all permanent job vacancies requiring process or methodology skills in the UK excluding London.

Permanent vacancies with a requirement for process or methodology skills 36,483 61,419 55,450
As % of all permanent jobs advertised in the UK excluding London 92.65% 82.37% 95.58%
Number of salaries quoted 17,392 42,187 28,711
10th Percentile £26,250 £27,250 £30,500
25th Percentile £36,750 £36,250 £40,000
Median annual salary (50th Percentile) £51,574 £50,000 £55,000
Median % change year-on-year +3.15% -9.09% +4.76%
75th Percentile £65,000 £65,000 £70,000
90th Percentile £77,500 £77,500 £82,500
UK median annual salary £57,443 £55,000 £60,899
% change year-on-year +4.44% -9.69% +1.50%

Machine Learning
Job Vacancy Trend in the UK excluding London

Job postings citing Machine Learning as a proportion of all IT jobs advertised in the UK excluding London.
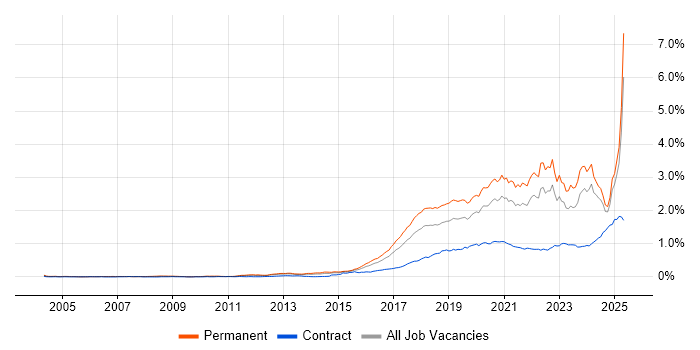
Job vacancy trend for Machine Learning in the UK excluding London

Machine Learning
Salary Trend in the UK excluding London

3-month moving average salary quoted in jobs citing Machine Learning in the UK excluding London.

Salary trend for Machine Learning in the UK excluding London

Machine Learning
Salary Histogram in the UK excluding London

Salary distribution for jobs citing Machine Learning in the UK excluding London over the 6 months to 30 May 2025.

Salary histogram for Machine Learning in the UK excluding London

Machine Learning
Job Locations in the UK excluding London

The table below looks at the demand and provides a guide to the median salaries quoted in IT jobs citing Machine Learning within the UK excluding London region over the 6 months to 30 May 2025. The 'Rank Change' column provides an indication of the change in demand within each location based on the same 6 month period last year.

Location Rank Change
on Same Period
Last Year
Matching
Permanent
IT Job Ads
Median Salary
Past 6 Months
Median Salary
% Change
on Same Period
Last Year
Live
Jobs
South East +82 483 £65,000 - 2,502
North of England +148 468 £63,250 +15.00% 1,549
Midlands +129 382 £60,000 +4.35% 1,293
North West +103 295 £62,500 +13.64% 727
East Midlands +131 220 £65,000 +30.00% 525
West Midlands +61 160 £47,500 -17.39% 681
Yorkshire +112 150 £64,000 +16.36% 631
South West +34 124 £61,954 -4.69% 846
Scotland -68 89 £70,000 +0.72% 333
East of England +20 70 £65,627 +0.96% 1,100
North East +56 23 £62,500 +31.58% 192
Wales +42 7 £67,750 +6.27% 190
Northern Ireland +35 3 - - 97
Channel Islands 0 3 £80,000 - 7
Isle of Man +13 1 - -
Machine Learning
UK

Machine Learning
Co-occurring Skills and Capabilities in the UK excluding London by Category

The follow tables expand on the table above by listing co-occurrences grouped by category. The same employment type, locality and period is covered with up to 20 co-occurrences shown in each of the following categories:

Application Platforms
1 47 (2.89%) Apache Spark
2 24 (1.47%) Jupyter
3 11 (0.68%) Apache
4 10 (0.61%) SharePoint
5 7 (0.43%) Apache Airflow
6 4 (0.25%) Camunda
6 4 (0.25%) Confluence
6 4 (0.25%) Oracle Workflow
6 4 (0.25%) SAS
7 3 (0.18%) Microsoft Exchange
8 2 (0.12%) ArcGIS
8 2 (0.12%) Luigi
8 2 (0.12%) Skype for Business
8 2 (0.12%) Tomcat
Applications
1 13 (0.80%) Microsoft Excel
2 12 (0.74%) Chatbot
3 2 (0.12%) Microsoft Office
3 2 (0.12%) Simulink
4 1 (0.061%) Microsoft PowerPoint
4 1 (0.061%) S-PLUS
Business Applications
1 1 (0.061%) Dynamics CRM
1 1 (0.061%) SAP S/4HANA
1 1 (0.061%) TrackWise
Cloud Services
1 401 (24.63%) Azure
2 395 (24.26%) AWS
3 318 (19.53%) GCP
4 94 (5.77%) Serverless
5 83 (5.10%) AWS Lambda
6 63 (3.87%) Power Platform
7 27 (1.66%) Amazon SageMaker
8 25 (1.54%) Azure Machine Learning
9 22 (1.35%) Amazon S3
10 21 (1.29%) Azure Data Factory
11 19 (1.17%) Azure Synapse Analytics
11 19 (1.17%) Vertex AI
12 16 (0.98%) GitHub
13 15 (0.92%) Amazon EC2
14 14 (0.86%) Cloud Computing
15 13 (0.80%) Snowflake
16 12 (0.74%) Microsoft 365
17 11 (0.68%) Azure DevOps
17 11 (0.68%) Azure Monitor
18 10 (0.61%) SaaS
Communications & Networking
1 65 (3.99%) Broadband
2 10 (0.61%) Internet
3 6 (0.37%) VPN
4 5 (0.31%) Firewall
5 4 (0.25%) DHCP
5 4 (0.25%) DNS
5 4 (0.25%) LoRaWAN
5 4 (0.25%) SAN
5 4 (0.25%) TCP/IP
6 3 (0.18%) WAN
7 2 (0.12%) MQTT
7 2 (0.12%) NAS
7 2 (0.12%) Skype
7 2 (0.12%) VLAN
8 1 (0.061%) PuTTY
8 1 (0.061%) SD-WAN
8 1 (0.061%) VoIP
Database & Business Intelligence
1 98 (6.02%) Big Data
2 62 (3.81%) Power BI
3 50 (3.07%) Data Lake
4 47 (2.89%) NoSQL
5 31 (1.90%) Data Mining
5 31 (1.90%) Tableau
6 29 (1.78%) Data Warehouse
7 26 (1.60%) PostgreSQL
8 24 (1.47%) SQL Server
9 22 (1.35%) MySQL
10 21 (1.29%) Hadoop
11 16 (0.98%) Elasticsearch
12 15 (0.92%) Relational Database
13 14 (0.86%) MongoDB
14 10 (0.61%) Cloud Spanner
14 10 (0.61%) Redis
15 8 (0.49%) Apache Cassandra
15 8 (0.49%) BigQuery
15 8 (0.49%) QlikView
16 7 (0.43%) Parquet
Development Applications
1 50 (3.07%) Git
2 15 (0.92%) JIRA
3 11 (0.68%) GitLab
4 9 (0.55%) Cypress.io
4 9 (0.55%) Jenkins
5 8 (0.49%) JUnit
5 8 (0.49%) Selenium
6 5 (0.31%) MLflow
7 4 (0.25%) SoapUI
8 3 (0.18%) ER Studio
8 3 (0.18%) Maven
8 3 (0.18%) Rational DOORS
8 3 (0.18%) Rational Rhapsody
8 3 (0.18%) RStudio
9 2 (0.12%) Gradle
9 2 (0.12%) JMeter
9 2 (0.12%) Locust
9 2 (0.12%) Robot Framework
9 2 (0.12%) Vite
9 2 (0.12%) webpack
General
1 766 (47.05%) Retail
2 762 (46.81%) Manufacturing
3 317 (19.47%) Inclusion and Diversity
4 258 (15.85%) Analytical Skills
5 250 (15.36%) Finance
6 192 (11.79%) Dutch Language
6 192 (11.79%) Finnish Language
6 192 (11.79%) Norwegian Language
7 190 (11.67%) Law
8 183 (11.24%) Social Skills
9 73 (4.48%) Marketing
10 69 (4.24%) Banking
11 48 (2.95%) Catalan Language
12 37 (2.27%) Influencing Skills
13 30 (1.84%) Legal
14 23 (1.41%) Public Sector
15 18 (1.11%) Pharmaceutical
16 13 (0.80%) Telecoms
17 11 (0.68%) Automotive
17 11 (0.68%) Games
Job Titles
1 730 (44.84%) Trainer
2 416 (25.55%) Senior
3 290 (17.81%) Software Engineer
4 192 (11.79%) Senior Software Engineer
5 109 (6.70%) Data Scientist
6 101 (6.20%) Lead
7 77 (4.73%) Machine Learning Engineer
8 48 (2.95%) Developer
9 40 (2.46%) Senior Data Scientist
10 34 (2.09%) Java Engineer
10 34 (2.09%) Java Software Engineer
11 28 (1.72%) Architect
12 26 (1.60%) Data Engineer
13 25 (1.54%) Data Analytics Director
14 19 (1.17%) Analyst
15 18 (1.11%) Python Engineer
16 17 (1.04%) Lead Software Engineer
17 15 (0.92%) Data Analyst
17 15 (0.92%) Python Software Engineer
18 14 (0.86%) Artificial Intelligence Engineer
Libraries, Frameworks & Software Standards
1 211 (12.96%) Node.js
2 199 (12.22%) .NET
3 73 (4.48%) HTML
4 66 (4.05%) React
5 57 (3.50%) TensorFlow
6 56 (3.44%) PyTorch
7 42 (2.58%) Kafka
8 36 (2.21%) scikit-learn
8 36 (2.21%) Spring
9 30 (1.84%) Spring Boot
10 27 (1.66%) RESTful
11 24 (1.47%) REST
12 21 (1.29%) CSS
13 19 (1.17%) NumPy
13 19 (1.17%) PySpark
14 15 (0.92%) Hugging Face
15 14 (0.86%) Keras
15 14 (0.86%) Pandas
16 13 (0.80%) AngularJS
17 12 (0.74%) LangChain
Miscellaneous
1 733 (45.02%) Robotics
2 246 (15.11%) Self-Motivation
3 218 (13.39%) Cyberattack
4 180 (11.06%) Algorithms
5 172 (10.57%) Linux Command Line
6 39 (2.40%) Cloud Native
7 34 (2.09%) Analytical Mindset
8 26 (1.60%) Public Cloud
9 20 (1.23%) IoT
10 18 (1.11%) FMCG
11 17 (1.04%) Management Information System
12 15 (0.92%) Mobile App
13 13 (0.80%) Legacy Systems
14 11 (0.68%) Greenfield Project
15 9 (0.55%) Renewable Energy
16 8 (0.49%) Blockchain
17 7 (0.43%) Credit Risk
17 7 (0.43%) Data Structures
17 7 (0.43%) Reinsurance
18 6 (0.37%) Reference Data
Operating Systems
1 208 (12.78%) Linux
2 19 (1.17%) Windows
3 13 (0.80%) Windows Server
4 6 (0.37%) Android
5 5 (0.31%) Apple iOS
5 5 (0.31%) Unix
6 3 (0.18%) Embedded Linux
6 3 (0.18%) Ubuntu
7 2 (0.12%) CentOS
7 2 (0.12%) Debian
7 2 (0.12%) Red Hat Enterprise Linux
7 2 (0.12%) VMS
7 2 (0.12%) Windows Server 2003
7 2 (0.12%) Windows Server 2019
Processes & Methodologies
1 1,213 (74.51%) Artificial Intelligence
2 1,016 (62.41%) Problem-Solving
3 815 (50.06%) LLM
4 794 (48.77%) Generative AI
5 720 (44.23%) Red Team
6 591 (36.30%) Data Privacy
7 475 (29.18%) Agile
8 367 (22.54%) Software Engineering
9 365 (22.42%) Data Science
10 317 (19.47%) Mentoring
11 269 (16.52%) Data Engineering
12 254 (15.60%) Analytics
13 217 (13.33%) Microservices
14 213 (13.08%) User Experience
15 205 (12.59%) Scrum
16 200 (12.29%) CI/CD
17 193 (11.86%) Cloud Security
18 185 (11.36%) Computer Science
19 184 (11.30%) Site Reliability Engineering
20 172 (10.57%) Visualisation
Programming Languages
1 550 (33.78%) Python
2 340 (20.88%) Java
3 303 (18.61%) JavaScript
4 256 (15.72%) C++
5 224 (13.76%) Rust
6 212 (13.02%) SQL
7 182 (11.18%) Go
8 153 (9.40%) TypeScript
9 95 (5.84%) C#
10 93 (5.71%) R
11 59 (3.62%) PHP
12 57 (3.50%) MATLAB
13 51 (3.13%) C
14 48 (2.95%) Dart
14 48 (2.95%) Ruby
15 15 (0.92%) Bash
16 14 (0.86%) PowerShell
17 13 (0.80%) Scala
18 8 (0.49%) T-SQL
19 7 (0.43%) PL/SQL
Qualifications
1 1,042 (64.00%) Degree
2 256 (15.72%) Security Cleared
3 238 (14.62%) DV Cleared
4 186 (11.43%) AWS Certification
5 174 (10.69%) AWS Certified Developer
6 172 (10.57%) AWS Certified Solutions Architect
7 107 (6.57%) Computer Science Degree
8 100 (6.14%) PhD
9 56 (3.44%) Master's Degree
10 26 (1.60%) Numerate Degree
11 15 (0.92%) Azure Certification
12 12 (0.74%) SC Cleared
13 4 (0.25%) Postgraduate
14 3 (0.18%) DBS Check
14 3 (0.18%) ISTQB
15 2 (0.12%) ISTQB Foundation Certification
15 2 (0.12%) MBA
15 2 (0.12%) Microsoft Certification
16 1 (0.061%) CCNA
16 1 (0.061%) Network+ Certification
Quality Assurance & Compliance
1 37 (2.27%) Accessibility
2 32 (1.97%) Data Quality
3 23 (1.41%) GDPR
4 15 (0.92%) California Consumer Privacy Act
5 13 (0.80%) Actionable Recommendations
6 10 (0.61%) QA
7 6 (0.37%) ISO/IEC 27001
8 5 (0.31%) GMP
8 5 (0.31%) SOC 2
9 4 (0.25%) PCI DSS
10 3 (0.18%) GxP
11 2 (0.12%) SLA
12 1 (0.061%) GLP
12 1 (0.061%) ISO 9001
12 1 (0.061%) NIST
System Software
1 97 (5.96%) Docker
2 10 (0.61%) VMware Infrastructure
3 7 (0.43%) VMware ESXi
4 5 (0.31%) Active Directory
4 5 (0.31%) HDFS
5 4 (0.25%) Hyper-V
6 3 (0.18%) LXC
7 1 (0.061%) Apache Flume
Systems Management
1 100 (6.14%) Kubernetes
2 36 (2.21%) Terraform
3 24 (1.47%) Grafana
4 18 (1.11%) Prometheus
5 15 (0.92%) Ansible
6 4 (0.25%) Puppet
6 4 (0.25%) SCOM
7 3 (0.18%) Kibana
7 3 (0.18%) Kubeflow
8 2 (0.12%) ITRS Geneos
8 2 (0.12%) Netcool
8 2 (0.12%) Netcool/OMNIbus
8 2 (0.12%) Progress Chef
8 2 (0.12%) Proxmox
8 2 (0.12%) SCCM
8 2 (0.12%) SCOrch
8 2 (0.12%) SCSM
8 2 (0.12%) Tivoli
9 1 (0.061%) FortiGate
9 1 (0.061%) Oozie
Vendors
1 778 (47.79%) Databricks
2 773 (47.48%) Google
3 720 (44.23%) Adobe
4 67 (4.12%) Microsoft
5 27 (1.66%) Oracle
6 26 (1.60%) OpenAI
7 17 (1.04%) Splunk
8 11 (0.68%) Dynatrace
9 10 (0.61%) IBM
9 10 (0.61%) SAP
9 10 (0.61%) VMware
10 8 (0.49%) ServiceNow
11 6 (0.37%) PayPal
12 5 (0.31%) Palantir
12 5 (0.31%) Salesforce
13 3 (0.18%) Informatica
13 3 (0.18%) Xilinx
14 2 (0.12%) ArcSight
14 2 (0.12%) Red Hat
14 2 (0.12%) Sybase