TOGAF Jobs in the UK excluding London

The Open Group Architecture Framework (TOGAF)
UK > UK excluding London

The following table provides summary statistics for permanent job vacancies advertised in the UK excluding London with a requirement for TOGAF skills. Included is a benchmarking guide to the salaries offered in vacancies that have cited TOGAF over the 6 months to 3 May 2024 with a comparison to the same period in the previous 2 years.

6 months to
3 May 2024
Same period 2023 Same period 2022
Rank 220 163 298
Rank change year-on-year -57 +135 +29
Permanent jobs citing TOGAF 934 1,293 837
As % of all permanent jobs advertised in the UK excluding London 1.33% 2.10% 1.18%
As % of the Processes & Methodologies category 1.57% 2.20% 1.25%
Number of salaries quoted 227 493 393
10th Percentile £52,500 £51,600 £50,000
25th Percentile £61,250 £61,250 £62,000
Median annual salary (50th Percentile) £71,840 £70,600 £75,000
Median % change year-on-year +1.76% -5.87% +7.14%
75th Percentile £88,750 £85,000 £84,702
90th Percentile £101,250 £92,500 £93,500
UK median annual salary £77,500 £79,000 £80,000
% change year-on-year -1.90% -1.25% +6.67%

All Process and Methodology Skills
UK excluding London

TOGAF is in the Processes and Methodologies category. The following table is for comparison with the above and provides summary statistics for all permanent job vacancies advertised in the UK excluding London with a requirement for process or methodology skills.

Permanent vacancies with a requirement for process or methodology skills 59,415 58,778 66,796
As % of all permanent jobs advertised in the UK excluding London 84.38% 95.62% 94.04%
Number of salaries quoted 41,129 30,196 41,543
10th Percentile £27,117 £30,500 £30,000
25th Percentile £36,250 £40,000 £38,750
Median annual salary (50th Percentile) £50,000 £55,000 £52,500
Median % change year-on-year -9.09% +4.76% +9.38%
75th Percentile £65,000 £70,000 £67,500
90th Percentile £77,500 £82,500 £80,000
UK median annual salary £55,000 £61,500 £60,000
% change year-on-year -10.57% +2.50% +9.09%

TOGAF
Job Vacancy Trend in the UK excluding London

Job postings citing TOGAF as a proportion of all IT jobs advertised in the UK excluding London.
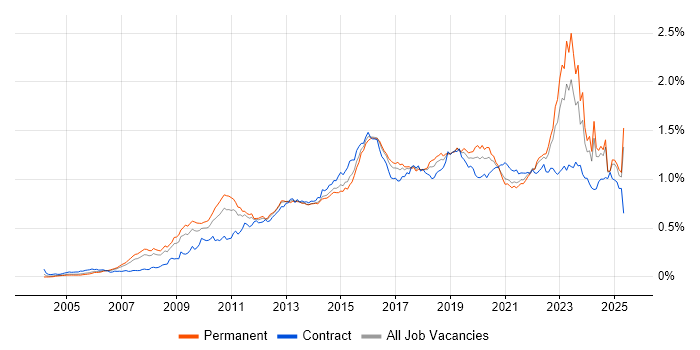
Job vacancy trend for TOGAF in the UK excluding London

TOGAF
Salary Trend in the UK excluding London

3-month moving average salary quoted in jobs citing TOGAF in the UK excluding London.

Salary trend for TOGAF in the UK excluding London

TOGAF
Salary Histogram in the UK excluding London

Salary distribution for jobs citing TOGAF in the UK excluding London over the 6 months to 3 May 2024.

Salary histogram for TOGAF in the UK excluding London

TOGAF
Job Locations in the UK excluding London

The table below looks at the demand and provides a guide to the median salaries quoted in IT jobs citing TOGAF within the UK excluding London region over the 6 months to 3 May 2024. The 'Rank Change' column provides an indication of the change in demand within each location based on the same 6 month period last year.

Location Rank Change
on Same Period
Last Year
Matching
Permanent
IT Job Ads
Median Salary
Past 6 Months
Median Salary
% Change
on Same Period
Last Year
Live
Jobs
North of England +3 227 £76,000 +7.65% 27
South East -65 197 £85,000 - 31
South West -13 173 £65,000 -7.14% 20
North West -10 128 £70,000 -0.85% 16
Scotland -71 121 £80,000 +22.42% 17
Yorkshire +56 98 £77,500 +6.90% 6
Midlands -59 98 £75,000 +6.23% 15
East Midlands -20 57 £76,250 +8.00% 7
Northern Ireland +44 55 - - 3
Wales -21 54 - - 6
West Midlands -59 39 £75,000 +6.23% 8
Isle of Man - 7 £82,500 - 2
East of England -37 3 £80,500 +0.63% 6
North East -27 1 £97,500 +38.10% 5
TOGAF
UK

TOGAF
Co-occurring Skills and Capabilities in the UK excluding London by Category

The follow tables expand on the table above by listing co-occurrences grouped by category. The same employment type, locality and period is covered with up to 20 co-occurrences shown in each of the following categories:

Application Platforms
1 75 (8.03%) SAS
2 40 (4.28%) WebLogic
3 12 (1.28%) Confluence
4 11 (1.18%) SharePoint
5 7 (0.75%) Microsoft Exchange
6 4 (0.43%) ArcGIS
7 3 (0.32%) SharePoint 2010
7 3 (0.32%) SharePoint 2013
8 2 (0.21%) Apache Airflow
8 2 (0.21%) Oracle Workflow
9 1 (0.11%) CMS
Business Applications
1 83 (8.89%) Sparx Enterprise Architect
2 76 (8.14%) SAP ERP
3 29 (3.10%) Remedy ITSM
4 3 (0.32%) Maximo
4 3 (0.32%) SAP S/4HANA
5 2 (0.21%) Dynamics CRM
5 2 (0.21%) SAP MM
5 2 (0.21%) SAP SD
6 1 (0.11%) Salesforce CRM
6 1 (0.11%) Teamcenter
Cloud Services
1 269 (28.80%) Azure
2 182 (19.49%) AWS
3 138 (14.78%) Microsoft 365
4 89 (9.53%) SaaS
5 80 (8.57%) GCP
6 53 (5.67%) Power Platform
7 40 (4.28%) Amazon EKS
7 40 (4.28%) Amazon SQS
8 30 (3.21%) Azure DevOps
9 26 (2.78%) PaaS
9 26 (2.78%) Snowflake
10 22 (2.36%) IaaS
11 21 (2.25%) Matillion
12 18 (1.93%) Serverless
13 15 (1.61%) Dynamics 365
14 13 (1.39%) Cloud Computing
15 7 (0.75%) PowerApps
16 5 (0.54%) Azure Data Factory
17 4 (0.43%) Azure Synapse Analytics
18 3 (0.32%) WhatsApp
Communications & Networking
1 344 (36.83%) VSAT
2 75 (8.03%) Broadband
3 47 (5.03%) TCP/IP
4 45 (4.82%) DNS
5 40 (4.28%) BGP
5 40 (4.28%) SSL
6 14 (1.50%) Network Security
7 8 (0.86%) Firewall
8 7 (0.75%) Intranet
8 7 (0.75%) VPN
9 5 (0.54%) DHCP
9 5 (0.54%) VoIP
10 3 (0.32%) Internet
10 3 (0.32%) PBX
11 2 (0.21%) 4G
11 2 (0.21%) 5G
11 2 (0.21%) SNMP
12 1 (0.11%) SD-WAN
12 1 (0.11%) WAN
12 1 (0.11%) Wi-Fi
Database & Business Intelligence
1 45 (4.82%) Data Warehouse
2 40 (4.28%) Amazon RDS
2 40 (4.28%) Oracle Database
2 40 (4.28%) RDBMS
2 40 (4.28%) Relational Database
3 32 (3.43%) Power BI
4 23 (2.46%) Data Lake
4 23 (2.46%) Metadata
5 10 (1.07%) Data Vault
5 10 (1.07%) Tableau
6 9 (0.96%) SQL Server
7 7 (0.75%) GIS
7 7 (0.75%) Redis
8 6 (0.64%) NoSQL
9 5 (0.54%) Elasticsearch
10 4 (0.43%) DB2
10 4 (0.43%) Geospatial Data
11 3 (0.32%) Big Data
11 3 (0.32%) QualityStage
12 2 (0.21%) BigQuery
Development Applications
1 12 (1.28%) JIRA
2 10 (1.07%) Rational DOORS
3 3 (0.32%) Jenkins
3 3 (0.32%) Team Foundation Server
4 1 (0.11%) Git
General
1 196 (20.99%) Social Skills
2 158 (16.92%) Finance
3 109 (11.67%) Presentation Skills
4 44 (4.71%) Influencing Skills
5 40 (4.28%) Analytical Skills
6 21 (2.25%) Public Sector
7 20 (2.14%) Legal
8 19 (2.03%) Inclusion and Diversity
9 18 (1.93%) Aerospace
10 9 (0.96%) Marketing
11 7 (0.75%) Manufacturing
11 7 (0.75%) Pharmaceutical
12 6 (0.64%) Billing
13 5 (0.54%) Law
14 4 (0.43%) Telecoms
14 4 (0.43%) Wearables
15 3 (0.32%) Local Government
15 3 (0.32%) Retail
16 2 (0.21%) Military
16 2 (0.21%) Organisational Skills
Job Titles
1 875 (93.68%) Architect
2 345 (36.94%) Software Architect
3 293 (31.37%) Solutions Architect
4 73 (7.82%) Cloud Architect
5 49 (5.25%) Enterprise Architect
6 48 (5.14%) Lead
6 48 (5.14%) Lead Architect
7 44 (4.71%) Lead Solutions Architect
8 38 (4.07%) Data Architect
9 37 (3.96%) Senior
10 35 (3.75%) Senior Architect
11 32 (3.43%) Senior Solutions Architect
12 30 (3.21%) ServiceNow Architect
13 21 (2.25%) Systems Architect
14 17 (1.82%) Digital Architect
15 16 (1.71%) Digital Solutions Architect
16 14 (1.50%) Enterprise Data Architect
16 14 (1.50%) Security Architect
16 14 (1.50%) Technical Architect
17 12 (1.28%) IT Architect
Libraries, Frameworks & Software Standards
1 46 (4.93%) .NET
2 40 (4.28%) RabbitMQ
2 40 (4.28%) Spring Boot
3 8 (0.86%) .NET Framework
4 7 (0.75%) Middleware
5 4 (0.43%) Blazor
6 3 (0.32%) .NET Core
6 3 (0.32%) AngularJS
6 3 (0.32%) ASP.NET
6 3 (0.32%) ASP.NET MVC
6 3 (0.32%) CSS
6 3 (0.32%) HTML
6 3 (0.32%) REST
7 2 (0.21%) EDI
8 1 (0.11%) ARM Templates
8 1 (0.11%) RESTful
Miscellaneous
1 118 (12.63%) Public Cloud
2 70 (7.49%) PKI
3 56 (6.00%) Management Information System
4 42 (4.50%) Enterprise Software
5 40 (4.28%) Cloud Native
6 20 (2.14%) Data Structures
7 14 (1.50%) Data Centre
8 9 (0.96%) Taxonomies
9 8 (0.86%) Greenfield Project
9 8 (0.86%) Self-Motivation
10 7 (0.75%) Analytical Mindset
10 7 (0.75%) Biopharmaceutical
10 7 (0.75%) Mobile App
11 4 (0.43%) Legacy Systems
11 4 (0.43%) PMI
12 3 (0.32%) Blackberry
12 3 (0.32%) Educational Technology
12 3 (0.32%) Hybrid Cloud
12 3 (0.32%) IoT
12 3 (0.32%) Video Conferencing
Operating Systems
1 54 (5.78%) Linux
2 40 (4.28%) Red Hat Enterprise Linux
3 18 (1.93%) Windows
4 9 (0.96%) Android
4 9 (0.96%) Apple iOS
5 3 (0.32%) Unix
Processes & Methodologies
1 530 (56.75%) Actionable Insight
2 387 (41.43%) Technical Architecture
3 364 (38.97%) Validation
4 363 (38.87%) Model Validation
4 363 (38.87%) Requirements Management
5 348 (37.26%) Network Management
6 346 (37.04%) Network Architecture
7 269 (28.80%) Agile
8 238 (25.48%) Enterprise Architecture
9 182 (19.49%) Project Management
10 164 (17.56%) Roadmaps
11 157 (16.81%) ArchiMate
12 130 (13.92%) Presales
13 119 (12.74%) Migration
14 97 (10.39%) Data Management
15 96 (10.28%) Change Management
16 91 (9.74%) Strategic Roadmap
17 89 (9.53%) Scrum
18 88 (9.42%) DevOps
19 85 (9.10%) Collaborative Working
Programming Languages
1 35 (3.75%) SQL
2 21 (2.25%) T-SQL
3 7 (0.75%) Java
4 4 (0.43%) C#
4 4 (0.43%) Python
4 4 (0.43%) RPG
5 3 (0.32%) JavaScript
Qualifications
1 193 (20.66%) Security Cleared
2 144 (15.42%) SC Cleared
3 135 (14.45%) TOGAF Certification
4 90 (9.64%) Degree
5 55 (5.89%) Azure Certification
6 42 (4.50%) AWS Certification
7 41 (4.39%) AWS Certified Solutions Architect
8 29 (3.10%) BPSS Clearance
9 22 (2.36%) CISSP
10 19 (2.03%) Microsoft Certification
11 17 (1.82%) PMI Certification
12 15 (1.61%) Computer Science Degree
13 13 (1.39%) PMP
14 12 (1.28%) APMG
15 8 (0.86%) CESG Certified Professional
16 7 (0.75%) CISMP
16 7 (0.75%) CREST Certified
17 4 (0.43%) Master's Degree
18 3 (0.32%) DV Cleared
18 3 (0.32%) MCPD
Quality Assurance & Compliance
1 35 (3.75%) COBIT
2 19 (2.03%) GDPR
3 13 (1.39%) ISO/IEC 27001
4 7 (0.75%) GRC
4 7 (0.75%) HMG Security Policy Framework
5 6 (0.64%) SLA
6 5 (0.54%) QA
7 3 (0.32%) Accessibility
7 3 (0.32%) NCSC
8 2 (0.21%) Data Quality
8 2 (0.21%) NIST
9 1 (0.11%) ECSS
9 1 (0.11%) PCI DSS
9 1 (0.11%) PMO
9 1 (0.11%) SOC 2
System Software
1 5 (0.54%) Active Directory
1 5 (0.54%) Hyper-V
2 3 (0.32%) Docker
3 2 (0.21%) VMware Infrastructure
4 1 (0.11%) Virtual Desktop
Systems Management
1 29 (3.10%) OpenView
2 8 (0.86%) Kubernetes
3 6 (0.64%) Terraform
3 6 (0.64%) ZABBIX
4 5 (0.54%) Grafana
4 5 (0.54%) Prometheus
4 5 (0.54%) SCOM
5 4 (0.43%) Jamf Pro
6 2 (0.21%) Nagios
6 2 (0.21%) Netcool
7 1 (0.11%) Ansible
7 1 (0.11%) Progress Chef
Vendors
1 180 (19.27%) Microsoft
2 128 (13.70%) Oracle
3 83 (8.89%) Google
3 83 (8.89%) Sparx
4 82 (8.78%) SAP
5 75 (8.03%) Anaplan
5 75 (8.03%) Hyperion
6 45 (4.82%) ServiceNow
7 29 (3.10%) BMC
7 29 (3.10%) HP
7 29 (3.10%) Remedy
8 26 (2.78%) Salesforce
9 25 (2.68%) Databricks
10 7 (0.75%) SolarWinds
11 5 (0.54%) IBM
11 5 (0.54%) New Relic
12 4 (0.43%) Cisco
12 4 (0.43%) ESRI
12 4 (0.43%) Tanium
13 3 (0.32%) Adobe