IBM WebSphere
UK

The following table provides summary statistics for permanent job vacancies with a requirement for WebSphere skills. Included is a benchmarking guide to the salaries offered in vacancies that have cited WebSphere over the 6 months to 7 December 2023 with a comparison to the same period in the previous 2 years.

6 months to
7 Dec 2023
Same period 2022 Same period 2021
Rank 648 829 922
Rank change year-on-year +181 +93 -320
Permanent jobs citing WebSphere 82 246 158
As % of all permanent jobs advertised in the UK 0.15% 0.20% 0.12%
As % of the Application Platforms category 1.58% 1.70% 0.99%
Number of salaries quoted 48 180 121
10th Percentile £36,000 £37,750 -
25th Percentile £48,218 £55,000 £32,500
Median annual salary (50th Percentile) £70,000 £69,724 £50,000
Median % change year-on-year +0.40% +39.45% -25.93%
75th Percentile £82,548 £95,000 £76,250
90th Percentile - £97,500 £87,500
UK excluding London median annual salary £70,000 £55,000 £40,000
% change year-on-year +27.27% +37.50% -25.93%

All Application Platform Skills
UK

WebSphere is in the Application Platforms category. The following table is for comparison with the above and provides summary statistics for all permanent job vacancies with a requirement for application platform skills.

Permanent vacancies with a requirement for application platform skills 5,189 14,436 16,006
As % of all permanent jobs advertised in the UK 9.79% 11.75% 12.49%
Number of salaries quoted 3,931 8,523 10,326
10th Percentile £31,500 £31,250 £30,000
25th Percentile £40,500 £41,250 £37,883
Median annual salary (50th Percentile) £55,000 £57,500 £55,000
Median % change year-on-year -4.35% +4.55% +4.76%
75th Percentile £77,500 £78,875 £72,500
90th Percentile £95,000 £97,290 £90,000
UK excluding London median annual salary £49,565 £50,000 £45,369
% change year-on-year -0.87% +10.21% +0.82%

WebSphere
Job Vacancy Trend

Job postings citing WebSphere as a proportion of all IT jobs advertised.
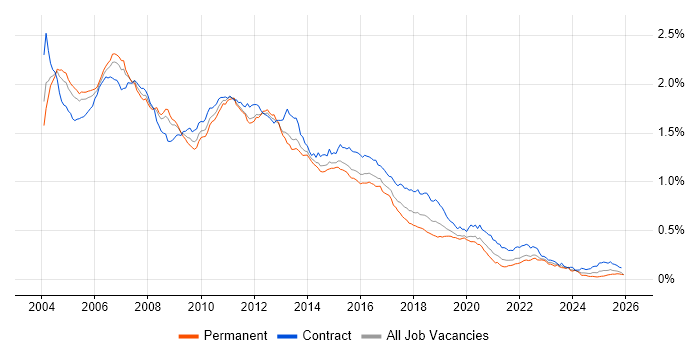
Job vacancy trend for WebSphere in the UK

WebSphere
Salary Trend

3-month moving average salary quoted in jobs citing WebSphere.

Salary trend for WebSphere in the UK

WebSphere
Salary Histogram

Salary distribution for jobs citing WebSphere over the 6 months to 7 December 2023.

Salary histogram for WebSphere in the UK

WebSphere
Top 14 Job Locations

The table below looks at the demand and provides a guide to the median salaries quoted in IT jobs citing WebSphere within the UK over the 6 months to 7 December 2023. The 'Rank Change' column provides an indication of the change in demand within each location based on the same 6 month period last year.

Location Rank Change
on Same Period
Last Year
Matching
Permanent
IT Job Ads
Median Salary
Past 6 Months
Median Salary
% Change
on Same Period
Last Year
Live
Jobs
UK excluding London +206 61 £70,000 +27.27% 11
England +183 57 £75,000 +7.14% 24
Work from Home +164 29 £68,823 +1.09% 14
London +155 17 £69,447 -18.30% 15
South East +144 17 £36,000 -17.24% 5
North of England +135 17 £75,669 +8.10% 3
Scotland +31 17 £50,000 -28.00% 1
Yorkshire +92 9 £75,669 +8.10% 2
North West +121 8 £75,669 +37.88% 1
South West +72 4 £75,669 +129.30%
Northern Ireland +40 3 £70,000 +7.69%
Midlands +111 2 - - 1
East Midlands +39 2 - -
Wales - 1 - -

WebSphere
Co-occurring Skills and Capabilities by Category

The follow tables expand on the table above by listing co-occurrences grouped by category. The same employment type, locality and period is covered with up to 20 co-occurrences shown in each of the following categories:

Application Platforms
1 26 (31.71%) WebSphere Application Server
2 24 (29.27%) Captiva
2 24 (29.27%) FileNet
3 15 (18.29%) IIS
4 11 (13.41%) Apache
5 10 (12.20%) MS Exchange
6 6 (7.32%) IBM HTTP Server
7 5 (6.10%) Confluence
8 4 (4.88%) Oracle HTTP Server
8 4 (4.88%) Tomcat
9 3 (3.66%) WebLogic
10 2 (2.44%) Apache Spark
10 2 (2.44%) JBoss
Applications
1 9 (10.98%) AutoCAD
1 9 (10.98%) PTC Creo
1 9 (10.98%) SOLIDWORKS
Business Applications
1 6 (7.32%) Oracle Cash Management
2 1 (1.22%) Oracle FAH
2 1 (1.22%) Oracle General Ledger
2 1 (1.22%) Payment Gateway
Cloud Services
1 39 (47.56%) Azure
2 32 (39.02%) GCP
3 31 (37.80%) GitHub
4 12 (14.63%) Azure DevOps
5 11 (13.41%) AWS
6 10 (12.20%) Entra ID
7 8 (9.76%) IaaS
7 8 (9.76%) PaaS
8 3 (3.66%) SaaS
9 2 (2.44%) OpenShift
10 1 (1.22%) Azure Service Fabric
10 1 (1.22%) NuGet
10 1 (1.22%) WhatsApp
Communications & Networking
1 4 (4.88%) HTTP
2 2 (2.44%) Firewall
2 2 (2.44%) Internet
2 2 (2.44%) VPN
3 1 (1.22%) DMZ
3 1 (1.22%) Intrusion Detection
3 1 (1.22%) Kerberos
3 1 (1.22%) LAN
3 1 (1.22%) TCP/IP
3 1 (1.22%) WAN
3 1 (1.22%) Wireless
Database & Business Intelligence
1 28 (34.15%) SQL Server
2 14 (17.07%) BusinessObjects
2 14 (17.07%) BusinessObjects Business Intelligence
3 12 (14.63%) Oracle Database
3 12 (14.63%) SAP HANA
4 8 (9.76%) DB2
5 5 (6.10%) Relational Database
6 4 (4.88%) Oracle Database 12c
7 3 (3.66%) Oracle Database 10g
8 2 (2.44%) Apache Hive
8 2 (2.44%) Big Data
8 2 (2.44%) Data Lake
8 2 (2.44%) Hadoop
8 2 (2.44%) NoSQL
8 2 (2.44%) Oracle Reports
9 1 (1.22%) RDBMS
Development Applications
1 43 (52.44%) JIRA
2 29 (35.37%) Git
3 26 (31.71%) Oracle Forms
4 19 (23.17%) Jenkins
5 14 (17.07%) Oracle APEX
6 10 (12.20%) Chocolatey
7 9 (10.98%) IBM UrbanCode
8 5 (6.10%) Cucumber
8 5 (6.10%) LoadRunner
8 5 (6.10%) Selenium
9 4 (4.88%) Maven
10 2 (2.44%) Bitbucket
10 2 (2.44%) Gradle
11 1 (1.22%) TeamCity
11 1 (1.22%) Visual Studio
General
1 41 (50.00%) Banking
2 40 (48.78%) Finance
3 20 (24.39%) Analytical Skills
4 9 (10.98%) Public Sector
5 8 (9.76%) Social Skills
6 5 (6.10%) Retail
7 3 (3.66%) Manufacturing
8 2 (2.44%) Automotive
8 2 (2.44%) Investment Banking
8 2 (2.44%) Presentation Skills
8 2 (2.44%) Retail Banking
9 1 (1.22%) Legal
9 1 (1.22%) Pharmaceutical
9 1 (1.22%) Telecoms
Job Titles
1 30 (36.59%) Software Engineer
2 24 (29.27%) FileNet Engineer
3 23 (28.05%) Analyst
4 14 (17.07%) Applications Support
4 14 (17.07%) Applications Support Analyst
4 14 (17.07%) Support Analyst
5 10 (12.20%) Automation Engineer
6 8 (9.76%) Infrastructure Engineer
7 7 (8.54%) Operations Analyst
8 5 (6.10%) Test Automation Engineer
8 5 (6.10%) Test Engineer
9 4 (4.88%) Developer
10 3 (3.66%) Administrator
10 3 (3.66%) Database Developer
10 3 (3.66%) DBA
10 3 (3.66%) DevOps Engineer
10 3 (3.66%) Junior
10 3 (3.66%) Junior Analyst
10 3 (3.66%) Oracle Database Developer
10 3 (3.66%) Oracle Developer
Libraries, Frameworks & Software Standards
1 16 (19.51%) .NET
1 16 (19.51%) SOAP
2 14 (17.07%) XML
3 10 (12.20%) Elastic Stack
3 10 (12.20%) YAML
4 7 (8.54%) HTML
4 7 (8.54%) JMS
4 7 (8.54%) Spring Boot
4 7 (8.54%) Web Services
4 7 (8.54%) WebSphere MQ
5 6 (7.32%) J2EE
6 5 (6.10%) REST
7 4 (4.88%) JDBC
7 4 (4.88%) JNDI
7 4 (4.88%) Middleware
7 4 (4.88%) Spring
8 3 (3.66%) JSON
8 3 (3.66%) Kafka
9 2 (2.44%) .NET Framework
9 2 (2.44%) Node.js
Miscellaneous
1 25 (30.49%) Private Cloud
2 24 (29.27%) DataPower
3 14 (17.07%) Product Ownership
4 13 (15.85%) Self-Motivation
5 12 (14.63%) Enterprise Software
6 9 (10.98%) Operational Technology
7 8 (9.76%) Public Cloud
8 4 (4.88%) Clustering
9 3 (3.66%) Life Science
9 3 (3.66%) Renewable Energy
10 2 (2.44%) Onboarding
10 2 (2.44%) Online Banking
10 2 (2.44%) Robotics
11 1 (1.22%) Data Centre
11 1 (1.22%) Derivative
11 1 (1.22%) Equities
11 1 (1.22%) Foreign Exchange (FX)
11 1 (1.22%) IBM Mainframe
11 1 (1.22%) Mainframe
11 1 (1.22%) Management Information System
Operating Systems
1 45 (54.88%) Unix
2 42 (51.22%) Linux
3 33 (40.24%) Windows
4 32 (39.02%) Windows Server
5 8 (9.76%) Windows Server 2012
6 2 (2.44%) Red Hat Enterprise Linux
7 1 (1.22%) Windows Server 2016
Processes & Methodologies
1 59 (71.95%) DevOps
2 41 (50.00%) Agile
3 38 (46.34%) Software Engineering
4 36 (43.90%) Problem-Solving
5 34 (41.46%) Migration
6 32 (39.02%) Change Management
7 28 (34.15%) Mentoring
8 25 (30.49%) Coaching
9 19 (23.17%) Root Cause Analysis
10 17 (20.73%) CI/CD
10 17 (20.73%) ITIL
11 16 (19.51%) Business Intelligence
12 15 (18.29%) ITSM
12 15 (18.29%) Project Delivery
12 15 (18.29%) Service Management
13 14 (17.07%) Actionable Insight
13 14 (17.07%) Knowledge Transfer
13 14 (17.07%) Problem Management
13 14 (17.07%) Web Development
14 11 (13.41%) ERP
Programming Languages
1 52 (63.41%) Java
2 50 (60.98%) SQL
3 25 (30.49%) PowerShell
4 20 (24.39%) PL/SQL
5 10 (12.20%) Bash
6 9 (10.98%) MATLAB
7 5 (6.10%) Python
8 3 (3.66%) T-SQL
9 2 (2.44%) ABAP
9 2 (2.44%) C
9 2 (2.44%) C#
9 2 (2.44%) JavaScript
10 1 (1.22%) C++
10 1 (1.22%) XPath
Qualifications
1 20 (24.39%) Security Cleared
2 15 (18.29%) SC Cleared
3 14 (17.07%) ITIL Certification
4 10 (12.20%) MCSA
4 10 (12.20%) MCSE
4 10 (12.20%) Microsoft Certification
5 9 (10.98%) AWS Certification
5 9 (10.98%) AWS Certified Solutions Architect
6 8 (9.76%) Azure Certification
7 2 (2.44%) Degree
7 2 (2.44%) OCP
7 2 (2.44%) Oracle Certification
8 1 (1.22%) CISA
8 1 (1.22%) CISSP
Quality Assurance & Compliance
1 24 (29.27%) GDPR
2 14 (17.07%) QA
3 2 (2.44%) Data Quality
4 1 (1.22%) COREP
4 1 (1.22%) Cyber Essentials
4 1 (1.22%) Cyber Essentials PLUS
4 1 (1.22%) FISMA
4 1 (1.22%) HIPAA
4 1 (1.22%) HITRUST
4 1 (1.22%) IFRS
4 1 (1.22%) IFRS 17
4 1 (1.22%) IFRS 9
4 1 (1.22%) ISO 15022
4 1 (1.22%) ISO 20022
4 1 (1.22%) ISO/IEC 27001
4 1 (1.22%) NIST
4 1 (1.22%) PCI DSS
4 1 (1.22%) Sarbanes-Oxley
4 1 (1.22%) SEPA
4 1 (1.22%) SLA
System Software
1 11 (13.41%) Active Directory
2 4 (4.88%) Oracle RAC
2 4 (4.88%) Tivoli Workload Scheduler
3 2 (2.44%) Docker
4 1 (1.22%) VMware ESXi
4 1 (1.22%) VMware Infrastructure
4 1 (1.22%) vSphere
Systems Management
1 11 (13.41%) Active Directory Federation Services
2 10 (12.20%) Ansible
2 10 (12.20%) SCCM
2 10 (12.20%) SCOM
2 10 (12.20%) Terraform
3 7 (8.54%) Oracle RMAN
3 7 (8.54%) Tivoli
4 4 (4.88%) Data Guard
5 3 (3.66%) Kubernetes
6 1 (1.22%) Progress Chef
Vendors
1 62 (75.61%) Oracle
2 48 (58.54%) IBM
3 38 (46.34%) ServiceNow
4 36 (43.90%) SAP
5 34 (41.46%) Microsoft
6 24 (29.27%) Kofax
6 24 (29.27%) Pega
7 10 (12.20%) Red Hat
7 10 (12.20%) TOWER Software
8 9 (10.98%) MathWorks
8 9 (10.98%) PTC
9 8 (9.76%) Splunk
10 7 (8.54%) Dynatrace
11 5 (6.10%) HP
12 2 (2.44%) Ab Initio
12 2 (2.44%) Databricks
13 1 (1.22%) Citrix
13 1 (1.22%) VMware