Infrastructure Architect
UK
The median Infrastructure Architect salary in the UK is £77,500 per year, according to job vacancies posted during the 6 months leading to 28 May 2025.
The table below provides salary benchmarking and summary statistics, comparing them to the same period in the previous two years.
| 6 months to 28 May 2025 |
Same period 2024 | Same period 2023 | |
|---|---|---|---|
| Rank | 666 | 716 | 600 |
| Rank change year-on-year | +50 | -116 | +430 |
| Permanent jobs requiring an Infrastructure Architect | 45 | 196 | 397 |
| As % of all permanent jobs advertised in the UK | 0.082% | 0.19% | 0.41% |
| As % of the Job Titles category | 0.091% | 0.20% | 0.44% |
| Number of salaries quoted | 26 | 144 | 98 |
| 10th Percentile | £62,500 | £62,500 | £56,219 |
| 25th Percentile | £63,750 | £69,688 | £61,250 |
| Median annual salary (50th Percentile) | £77,500 | £85,000 | £74,500 |
| Median % change year-on-year | -8.82% | +14.09% | -12.35% |
| 75th Percentile | £78,750 | £100,000 | £89,375 |
| 90th Percentile | £103,125 | £110,000 | £115,000 |
| UK excluding London median annual salary | £76,250 | £75,000 | £70,000 |
| % change year-on-year | +1.67% | +7.14% | - |
All Permanent IT Job Vacancies
UK
For comparison with the information above, the following table provides summary statistics for all permanent IT job vacancies. Most job vacancies include a discernible job title that can be normalized. As such, the figures in the second row provide an indication of the number of permanent jobs in our overall sample.
| Permanent vacancies in the UK with a recognized job title | 49,435 | 96,820 | 89,564 |
| % of permanent jobs with a recognized job title | 90.41% | 94.78% | 91.46% |
| Number of salaries quoted | 25,727 | 69,155 | 56,824 |
| 10th Percentile | £28,822 | £28,500 | £32,500 |
| 25th Percentile | £41,000 | £38,500 | £45,000 |
| Median annual salary (50th Percentile) | £55,000 | £52,500 | £60,000 |
| Median % change year-on-year | +4.76% | -12.50% | - |
| 75th Percentile | £73,750 | £70,000 | £80,000 |
| 90th Percentile | £96,250 | £90,000 | £100,000 |
| UK excluding London median annual salary | £51,399 | £50,000 | £53,500 |
| % change year-on-year | +2.80% | -6.54% | +6.63% |
Infrastructure Architect
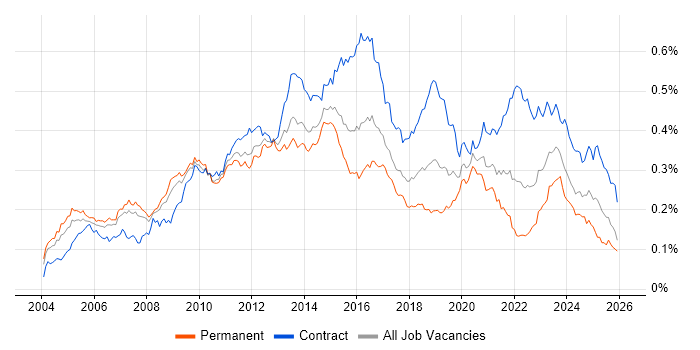
Job Vacancy Trend
Job postings that featured Infrastructure Architect in the job title as a proportion of all IT jobs advertised.

Infrastructure Architect
Salary Trend
3-month moving average salary quoted in jobs citing Infrastructure Architect.
Infrastructure Architect
Salary Histogram
Salary distribution for jobs citing Infrastructure Architect over the 6 months to 28 May 2025.
Infrastructure Architect
Top 12 Job Locations
The table below looks at the demand and provides a guide to the median salaries quoted in IT jobs citing Infrastructure Architect within the UK over the 6 months to 28 May 2025. The 'Rank Change' column provides an indication of the change in demand within each location based on the same 6 month period last year.
| Location | Rank Change on Same Period Last Year |
Matching Permanent IT Job Ads |
Median Salary Past 6 Months |
Median Salary % Change on Same Period Last Year |
Live Jobs |
|---|---|---|---|---|---|
| England | +31 | 44 | £77,500 | -8.82% | 51 |
| UK excluding London | +143 | 30 | £76,250 | +1.67% | 44 |
| Work from Home | +43 | 19 | £65,000 | -27.78% | 17 |
| South East | +71 | 16 | £77,500 | +3.33% | 17 |
| London | +32 | 14 | £105,000 | +10.53% | 12 |
| North of England | +40 | 9 | £65,000 | -38.10% | 4 |
| North East | +53 | 6 | £65,000 | -33.33% | 1 |
| Yorkshire | +59 | 3 | £65,000 | -42.22% | 1 |
| East of England | +45 | 3 | - | - | 6 |
| West Midlands | +54 | 2 | - | - | |
| Midlands | +50 | 2 | - | - | 8 |
| Northern Ireland | - | 1 | - | - | 2 |
Infrastructure Architect Skill Set
Top 30 Co-occurring Skills and Capabilities
For the 6 months to 28 May 2025, Infrastructure Architect job roles required the following skills and capabilities in order of popularity. The figures indicate the absolute number co-occurrences and as a proportion of all permanent job ads featuring Infrastructure Architect in the job title.
|
|
Infrastructure Architect Skill Set
Co-occurring Skills and Capabilities by Category
The follow tables expand on the table above by listing co-occurrences grouped by category. The same employment type, locality and period is covered with up to 20 co-occurrences shown in each of the following categories:
|
|
||||||||||||||||||||||||||||||||||||||||||||||||||||||||||||||||||||||||||||||||||||||||||||||||||||||
|
|
||||||||||||||||||||||||||||||||||||||||||||||||||||||||||||||||||||||||||||||||||||||||||||||||||||||
|
|
||||||||||||||||||||||||||||||||||||||||||||||||||||||||||||||||||||||||||||||||||||||||||||||||||||||
|
|
||||||||||||||||||||||||||||||||||||||||||||||||||||||||||||||||||||||||||||||||||||||||||||||||||||||
|
|
||||||||||||||||||||||||||||||||||||||||||||||||||||||||||||||||||||||||||||||||||||||||||||||||||||||
|
|
||||||||||||||||||||||||||||||||||||||||||||||||||||||||||||||||||||||||||||||||||||||||||||||||||||||
|
|
||||||||||||||||||||||||||||||||||||||||||||||||||||||||||||||||||||||||||||||||||||||||||||||||||||||
|
|
||||||||||||||||||||||||||||||||||||||||||||||||||||||||||||||||||||||||||||||||||||||||||||||||||||||
|
|||||||||||||||||||||||||||||||||||||||||||||||||||||||||||||||||||||||||||||||||||||||||||||||||||||||
