Java Developer
UK
The median Java Developer salary in the UK is £70,000 per year, according to job vacancies posted during the 6 months leading to 30 April 2025.
The table below provides salary benchmarking and summary statistics, comparing them to the same period in the previous two years.
| 6 months to 30 Apr 2025 |
Same period 2024 | Same period 2023 | |
|---|---|---|---|
| Rank | 377 | 277 | 192 |
| Rank change year-on-year | -100 | -85 | -36 |
| Permanent jobs requiring a Java Developer | 349 | 1,036 | 2,040 |
| As % of all permanent jobs advertised in the UK | 0.67% | 1.05% | 1.96% |
| As % of the Job Titles category | 0.74% | 1.11% | 2.14% |
| Number of salaries quoted | 250 | 863 | 1,665 |
| 10th Percentile | £42,500 | £42,500 | £48,750 |
| 25th Percentile | £53,750 | £54,375 | £58,750 |
| Median annual salary (50th Percentile) | £70,000 | £75,000 | £80,000 |
| Median % change year-on-year | -6.67% | -6.25% | +6.67% |
| 75th Percentile | £110,000 | £100,000 | £106,250 |
| 90th Percentile | £137,500 | £134,750 | £125,000 |
| UK excluding London median annual salary | £60,000 | £60,000 | £65,000 |
| % change year-on-year | - | -7.69% | +8.33% |
All Permanent IT Job Vacancies
UK
For comparison with the information above, the following table provides summary statistics for all permanent IT job vacancies. Most job vacancies include a discernible job title that can be normalized. As such, the figures in the second row provide an indication of the number of permanent jobs in our overall sample.
| Permanent vacancies in the UK with a recognized job title | 46,971 | 93,051 | 95,196 |
| % of permanent jobs with a recognized job title | 90.06% | 94.62% | 91.53% |
| Number of salaries quoted | 27,308 | 66,827 | 59,871 |
| 10th Percentile | £30,000 | £28,500 | £32,500 |
| 25th Percentile | £42,500 | £38,500 | £45,000 |
| Median annual salary (50th Percentile) | £57,500 | £52,750 | £60,000 |
| Median % change year-on-year | +9.00% | -12.08% | - |
| 75th Percentile | £75,000 | £71,250 | £81,250 |
| 90th Percentile | £97,500 | £90,000 | £100,000 |
| UK excluding London median annual salary | £52,344 | £50,000 | £52,500 |
| % change year-on-year | +4.69% | -4.76% | +5.00% |
Java Developer
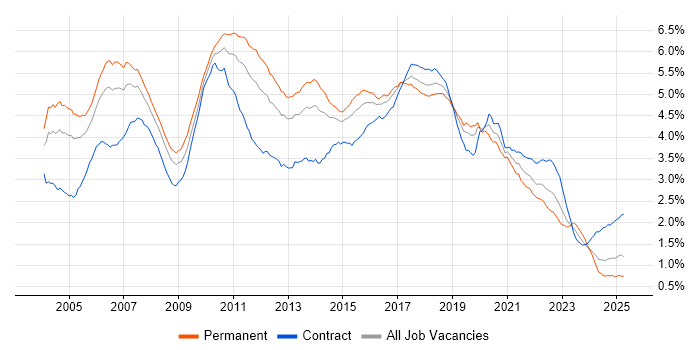
Job Vacancy Trend
Job postings that featured Java Developer in the job title as a proportion of all IT jobs advertised.

Java Developer
Salary Trend
3-month moving average salary quoted in jobs citing Java Developer.
Java Developer
Salary Histogram
Salary distribution for jobs citing Java Developer over the 6 months to 30 April 2025.
Java Developer
Top 16 Job Locations
The table below looks at the demand and provides a guide to the median salaries quoted in IT jobs citing Java Developer within the UK over the 6 months to 30 April 2025. The 'Rank Change' column provides an indication of the change in demand within each location based on the same 6 month period last year.
| Location | Rank Change on Same Period Last Year |
Matching Permanent IT Job Ads |
Median Salary Past 6 Months |
Median Salary % Change on Same Period Last Year |
Live Jobs |
|---|---|---|---|---|---|
| England | -105 | 304 | £75,000 | -6.25% | 125 |
| London | -84 | 193 | £105,000 | +16.67% | 63 |
| UK excluding London | +1 | 186 | £60,000 | - | 91 |
| Work from Home | -12 | 157 | £60,000 | -20.00% | 95 |
| South East | +42 | 83 | £60,000 | -14.29% | 17 |
| Scotland | +82 | 32 | £57,500 | -4.17% | 21 |
| Midlands | +62 | 31 | £60,000 | +20.00% | 7 |
| North of England | +25 | 22 | £67,500 | +12.50% | 31 |
| West Midlands | +48 | 17 | £60,000 | +9.09% | 5 |
| East Midlands | +54 | 14 | £60,000 | +41.18% | 2 |
| North West | -17 | 11 | £67,500 | +8.00% | 21 |
| South West | +59 | 10 | £60,000 | - | 7 |
| Yorkshire | +65 | 8 | £44,500 | -19.09% | 8 |
| Northern Ireland | +37 | 7 | - | - | 7 |
| North East | +48 | 3 | - | - | 2 |
| East of England | +45 | 3 | £55,000 | +10.00% | 3 |
Java Developer Skill Set
Top 30 Co-occurring Skills and Capabilities
For the 6 months to 30 April 2025, Java Developer job roles required the following skills and capabilities in order of popularity. The figures indicate the absolute number co-occurrences and as a proportion of all permanent job ads featuring Java Developer in the job title.
|
|
Java Developer Skill Set
Co-occurring Skills and Capabilities by Category
The follow tables expand on the table above by listing co-occurrences grouped by category. The same employment type, locality and period is covered with up to 20 co-occurrences shown in each of the following categories:
|
|
||||||||||||||||||||||||||||||||||||||||||||||||||||||||||||||||||||||||||||||||||||||||||||||||||||||||||||||||||||||||||||||
|
|
||||||||||||||||||||||||||||||||||||||||||||||||||||||||||||||||||||||||||||||||||||||||||||||||||||||||||||||||||||||||||||||
|
|
||||||||||||||||||||||||||||||||||||||||||||||||||||||||||||||||||||||||||||||||||||||||||||||||||||||||||||||||||||||||||||||
|
|
||||||||||||||||||||||||||||||||||||||||||||||||||||||||||||||||||||||||||||||||||||||||||||||||||||||||||||||||||||||||||||||
|
|
||||||||||||||||||||||||||||||||||||||||||||||||||||||||||||||||||||||||||||||||||||||||||||||||||||||||||||||||||||||||||||||
|
|
||||||||||||||||||||||||||||||||||||||||||||||||||||||||||||||||||||||||||||||||||||||||||||||||||||||||||||||||||||||||||||||
|
|
||||||||||||||||||||||||||||||||||||||||||||||||||||||||||||||||||||||||||||||||||||||||||||||||||||||||||||||||||||||||||||||
|
|
||||||||||||||||||||||||||||||||||||||||||||||||||||||||||||||||||||||||||||||||||||||||||||||||||||||||||||||||||||||||||||||
|
|||||||||||||||||||||||||||||||||||||||||||||||||||||||||||||||||||||||||||||||||||||||||||||||||||||||||||||||||||||||||||||||
