Oracle Forms
UK

The following table provides summary statistics for permanent job vacancies with a requirement for Oracle Forms skills. Included is a benchmarking guide to the salaries offered in vacancies that have cited Oracle Forms over the 6 months to 4 December 2023 with a comparison to the same period in the previous 2 years.

6 months to
4 Dec 2023
Same period 2022 Same period 2021
Rank 645 975 937
Rank change year-on-year +330 -38 -261
Permanent jobs citing Oracle Forms 96 101 162
As % of all permanent jobs advertised in the UK 0.18% 0.081% 0.13%
As % of the Development Applications category 1.39% 0.45% 0.62%
Number of salaries quoted 76 39 76
10th Percentile £55,000 £38,000 £37,500
25th Percentile £57,866 £46,250 £42,250
Median annual salary (50th Percentile) £70,576 £55,000 £52,000
Median % change year-on-year +28.32% +5.77% +4.00%
75th Percentile £82,548 £65,000 £65,000
90th Percentile £91,934 £82,500 £75,000
UK excluding London median annual salary £70,576 £55,000 £50,000
% change year-on-year +28.32% +10.00% -

All Development Application Skills
UK

Oracle Forms is in the Development Applications category. The following table is for comparison with the above and provides summary statistics for all permanent job vacancies with a requirement for development application skills.

Permanent vacancies with a requirement for development application skills 6,903 22,328 26,291
As % of all permanent jobs advertised in the UK 12.97% 18.01% 20.50%
Number of salaries quoted 5,279 12,623 16,358
10th Percentile £42,255 £39,750 £36,750
25th Percentile £50,000 £48,581 £45,000
Median annual salary (50th Percentile) £65,000 £65,000 £60,000
Median % change year-on-year - +8.33% +9.09%
75th Percentile £82,548 £81,250 £76,250
90th Percentile £98,000 £98,750 £91,250
UK excluding London median annual salary £58,750 £55,000 £50,000
% change year-on-year +6.82% +10.00% -

Oracle Forms
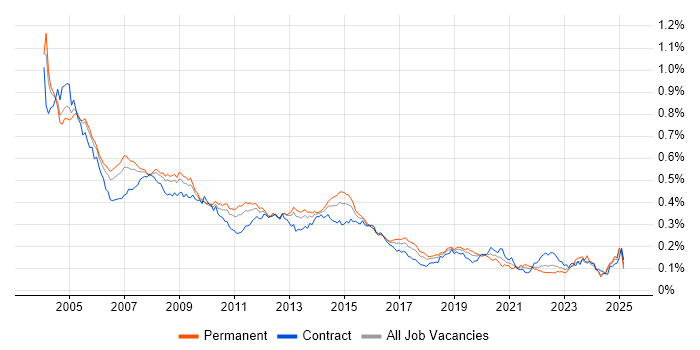
Job Vacancy Trend

Job postings citing Oracle Forms as a proportion of all IT jobs advertised.

Job vacancy trend for Oracle Forms in the UK

Oracle Forms
Salary Trend

3-month moving average salary quoted in jobs citing Oracle Forms.

Salary trend for Oracle Forms in the UK

Oracle Forms
Salary Histogram

Salary distribution for jobs citing Oracle Forms over the 6 months to 4 December 2023.

Salary histogram for Oracle Forms in the UK

Oracle Forms
Top 10 Job Locations

The table below looks at the demand and provides a guide to the median salaries quoted in IT jobs citing Oracle Forms within the UK over the 6 months to 4 December 2023. The 'Rank Change' column provides an indication of the change in demand within each location based on the same 6 month period last year.

Location Rank Change
on Same Period
Last Year
Matching
Permanent
IT Job Ads
Median Salary
Past 6 Months
Median Salary
% Change
on Same Period
Last Year
Live
Jobs
England +324 79 £70,576 +34.43% 18
UK excluding London +226 70 £70,576 +28.32% 5
Work from Home +244 42 £70,576 +24.36% 10
South West +94 36 £70,576 +20.64%
North of England +155 22 £55,000 +4.76% 1
Yorkshire +100 18 £55,000 -8.33%
London +278 17 £75,669 +44.13% 15
Scotland +60 10 £83,577 +4.47%
North West +106 4 £75,669 +44.13% 1
South East +151 2 £55,582 -5.79% 3

Oracle Forms
Co-occurring Skills and Capabilities by Category

The follow tables expand on the table above by listing co-occurrences grouped by category. The same employment type, locality and period is covered with up to 20 co-occurrences shown in each of the following categories:

Application Platforms
1 25 (26.04%) WebSphere
2 23 (23.96%) Captiva
2 23 (23.96%) FileNet
3 10 (10.42%) Oracle SOA Suite
3 10 (10.42%) WebLogic
4 5 (5.21%) Apache Spark
5 2 (2.08%) IBM HTTP Server
6 1 (1.04%) Oracle Workflow
6 1 (1.04%) SharePoint
Applications
1 4 (4.17%) Spreadsheet
2 1 (1.04%) Oracle Smart View
Business Applications
1 4 (4.17%) Oracle EBS
2 2 (2.08%) Oracle Cash Management
2 2 (2.08%) SAP FI-GL
3 1 (1.04%) SAP HR
Cloud Services
1 43 (44.79%) GCP
2 34 (35.42%) Azure
3 25 (26.04%) GitHub
4 24 (25.00%) SaaS
5 11 (11.46%) AWS
6 10 (10.42%) IaaS
6 10 (10.42%) PaaS
7 7 (7.29%) Oracle Service Cloud
8 2 (2.08%) Boomi
8 2 (2.08%) Cloud Computing
9 1 (1.04%) Microsoft 365
Communications & Networking
1 1 (1.04%) VPN
Database & Business Intelligence
1 28 (29.17%) Data Warehouse
2 22 (22.92%) Oracle Database
3 15 (15.63%) Oracle Reports
4 13 (13.54%) Data Mart
5 11 (11.46%) SQL Server
6 10 (10.42%) Oracle ODI
7 7 (7.29%) Relational Database
8 5 (5.21%) Big Data
8 5 (5.21%) BigQuery
8 5 (5.21%) Data Lake
8 5 (5.21%) Flink
8 5 (5.21%) Hadoop
9 4 (4.17%) BusinessObjects XI
9 4 (4.17%) Oracle Database 11g
9 4 (4.17%) Oracle Database 12c
9 4 (4.17%) PowerCenter
10 2 (2.08%) MySQL
10 2 (2.08%) SAP HANA
11 1 (1.04%) Metadata
Development Applications
1 27 (28.13%) JIRA
2 14 (14.58%) Jenkins
3 12 (12.50%) Git
4 10 (10.42%) IBM UrbanCode
5 5 (5.21%) ERwin
5 5 (5.21%) Oracle APEX
6 2 (2.08%) Maven
General
1 71 (73.96%) Finance
2 62 (64.58%) Banking
3 17 (17.71%) Social Skills
4 15 (15.63%) Inclusion and Diversity
4 15 (15.63%) Public Sector
5 13 (13.54%) Influencing Skills
5 13 (13.54%) Retail
6 9 (9.38%) Retail Finance
7 3 (3.13%) Presentation Skills
8 2 (2.08%) General Ledger
Job Titles
1 31 (32.29%) Software Engineer
2 23 (23.96%) FileNet Engineer
3 10 (10.42%) Consultant
3 10 (10.42%) Data Engineer
3 10 (10.42%) Platform Engineer
4 8 (8.33%) Senior
5 7 (7.29%) Cloud Engineer
5 7 (7.29%) Cloud Platform Engineer
6 6 (6.25%) Oracle Consultant
7 5 (5.21%) Architect
7 5 (5.21%) DBA
7 5 (5.21%) GCP Data Engineer
7 5 (5.21%) GCP Engineer
7 5 (5.21%) Lead
7 5 (5.21%) Lead Data Engineer
7 5 (5.21%) Software Architect
8 4 (4.17%) Analyst
8 4 (4.17%) Informatica Consultant
8 4 (4.17%) Technical Specialist
8 4 (4.17%) Tester
Libraries, Frameworks & Software Standards
1 17 (17.71%) Oracle Fusion
2 15 (15.63%) Velocity
3 10 (10.42%) REST
4 5 (5.21%) Apache Beam
4 5 (5.21%) Kafka
5 2 (2.08%) CSS
5 2 (2.08%) HTML
5 2 (2.08%) J2EE
5 2 (2.08%) jQuery
5 2 (2.08%) Middleware
5 2 (2.08%) Node.js
5 2 (2.08%) React
5 2 (2.08%) SOAP
5 2 (2.08%) Spring
5 2 (2.08%) Spring Boot
Miscellaneous
1 23 (23.96%) DataPower
1 23 (23.96%) Private Cloud
2 5 (5.21%) Algorithms
2 5 (5.21%) Data Fabric
2 5 (5.21%) Data Structures
2 5 (5.21%) Distributed Systems
2 5 (5.21%) Reference Data
3 4 (4.17%) Onboarding
3 4 (4.17%) SWIFT Messaging Network
4 3 (3.13%) Enterprise Cloud
4 3 (3.13%) Product Ownership
5 1 (1.04%) Mobile Banking
5 1 (1.04%) Robotics
Operating Systems
1 39 (40.63%) Linux
2 36 (37.50%) Unix
3 14 (14.58%) Red Hat Enterprise Linux
4 13 (13.54%) AIX
5 2 (2.08%) Windows
6 1 (1.04%) Windows Server
Processes & Methodologies
1 77 (80.21%) Agile
2 43 (44.79%) Software Engineering
3 33 (34.38%) DevOps
4 32 (33.33%) Coaching
5 31 (32.29%) Migration
6 27 (28.13%) Business Intelligence
6 27 (28.13%) Change Management
7 17 (17.71%) CI/CD
8 16 (16.67%) Mentoring
9 15 (15.63%) Collaborative Culture
9 15 (15.63%) Data Integration
10 13 (13.54%) Analytics
10 13 (13.54%) Dimensional Modelling
10 13 (13.54%) Root Cause Analysis
11 10 (10.42%) Platform Engineering
11 10 (10.42%) SOA
12 9 (9.38%) Batch Scheduling
12 9 (9.38%) Business Analytics
12 9 (9.38%) Continuous Integration
12 9 (9.38%) ETL
Programming Languages
1 49 (51.04%) SQL
2 47 (48.96%) Java
3 19 (19.79%) Python
4 15 (15.63%) PL/SQL
5 10 (10.42%) Shell Script
6 5 (5.21%) Go
6 5 (5.21%) Scala
7 2 (2.08%) ABAP
7 2 (2.08%) C
7 2 (2.08%) JavaScript
7 2 (2.08%) PHP
Qualifications
1 11 (11.46%) SC Cleared
1 11 (11.46%) Security Cleared
2 4 (4.17%) BPSS Clearance
3 2 (2.08%) Degree
Quality Assurance & Compliance
1 23 (23.96%) GDPR
2 9 (9.38%) SLA
3 8 (8.33%) QA
4 4 (4.17%) Data Quality
System Software
1 9 (9.38%) Docker
2 4 (4.17%) Oracle RAC
Systems Management
1 10 (10.42%) Ansible
1 10 (10.42%) Terraform
2 5 (5.21%) Kubernetes
Vendors
1 96 (100.00%) Oracle
2 33 (34.38%) SAP
3 27 (28.13%) IBM
4 23 (23.96%) Kofax
4 23 (23.96%) Pega
4 23 (23.96%) ServiceNow
5 11 (11.46%) Hyperion
6 10 (10.42%) Google
6 10 (10.42%) Red Hat
7 5 (5.21%) Teradata
8 4 (4.17%) Informatica
8 4 (4.17%) Microsoft
9 2 (2.08%) Dell
9 2 (2.08%) Dynatrace
9 2 (2.08%) Splunk