Java 2 Platform, Enterprise Edition (J2EE)
UK

The following table provides summary statistics for permanent job vacancies with a requirement for J2EE skills. Included is a benchmarking guide to the salaries offered in vacancies that have cited J2EE over the 6 months to 29 November 2023 with a comparison to the same period in the previous 2 years.

6 months to
29 Nov 2023
Same period 2022 Same period 2021
Rank 424 855 663
Rank change year-on-year +431 -192 -198
Permanent jobs citing J2EE 333 235 475
As % of all permanent jobs advertised in the UK 0.62% 0.19% 0.37%
As % of the Libraries, Frameworks & Software Standards category 2.33% 0.58% 0.95%
Number of salaries quoted 81 149 289
10th Percentile £60,000 £46,250 £43,500
25th Percentile £67,500 £52,500 £52,500
Median annual salary (50th Percentile) £75,000 £85,000 £72,500
Median % change year-on-year -11.76% +17.24% +7.41%
75th Percentile £91,934 £115,000 £92,500
90th Percentile £116,250 £136,250 £118,750
UK excluding London median annual salary £70,000 £55,000 £57,500
% change year-on-year +27.27% -4.35% -11.54%

All Software Libraries and Frameworks
UK

J2EE is in the Software Libraries and Frameworks category. The following table is for comparison with the above and provides summary statistics for all permanent job vacancies with a requirement for technical specification, industry standards, software libraries and framework skills.

Permanent vacancies with a requirement for technical specification, industry standards, software libraries and framework skills 14,303 40,800 50,175
As % of all permanent jobs advertised in the UK 26.43% 32.42% 38.88%
Number of salaries quoted 11,215 24,814 31,989
10th Percentile £41,250 £40,000 £36,250
25th Percentile £51,250 £49,995 £45,000
Median annual salary (50th Percentile) £67,250 £65,000 £60,000
Median % change year-on-year +3.46% +8.33% +4.35%
75th Percentile £85,000 £85,000 £80,000
90th Percentile £106,250 £104,991 £96,250
UK excluding London median annual salary £57,500 £57,500 £52,500
% change year-on-year - +9.52% +5.00%

J2EE
Job Vacancy Trend

Job postings citing J2EE as a proportion of all IT jobs advertised.
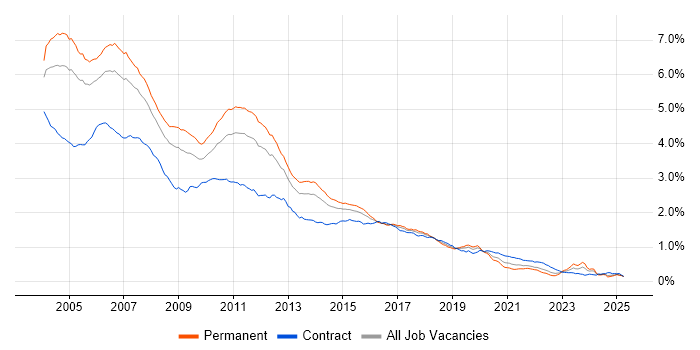
Job vacancy trend for J2EE in the UK

J2EE
Salary Trend

3-month moving average salary quoted in jobs citing J2EE.

Salary trend for J2EE in the UK

J2EE
Salary Histogram

Salary distribution for jobs citing J2EE over the 6 months to 29 November 2023.

Salary histogram for J2EE in the UK

J2EE
Top 15 Job Locations

The table below looks at the demand and provides a guide to the median salaries quoted in IT jobs citing J2EE within the UK over the 6 months to 29 November 2023. The 'Rank Change' column provides an indication of the change in demand within each location based on the same 6 month period last year.

Location Rank Change
on Same Period
Last Year
Matching
Permanent
IT Job Ads
Median Salary
Past 6 Months
Median Salary
% Change
on Same Period
Last Year
Live
Jobs
UK excluding London +395 267 £70,000 +27.27% 15
Work from Home +404 230 £70,000 +33.33% 10
England +330 192 £75,000 -11.76% 25
Wales - 68 - - 1
London +226 66 £91,250 -8.75% 16
South East +193 60 £50,000 -4.76% 6
Scotland +97 49 £70,000 +24.44% 4
North of England +159 42 £63,750 -1.92%
North West +127 27 £63,750 -1.92%
South West +64 15 £83,577 - 2
Yorkshire - 15 £61,538 -
Northern Ireland +42 14 £85,000 +70.00%
Midlands +123 11 - - 1
East Midlands +60 11 - -
East of England +124 9 £75,000 -11.76% 2

J2EE
Co-occurring Skills and Capabilities by Category

The follow tables expand on the table above by listing co-occurrences grouped by category. The same employment type, locality and period is covered with up to 20 co-occurrences shown in each of the following categories:

Application Platforms
1 87 (26.13%) WebLogic
2 33 (9.91%) IIS
3 13 (3.90%) SharePoint
4 10 (3.00%) JBoss
4 10 (3.00%) Tomcat
5 9 (2.70%) OpenStack
5 9 (2.70%) Red Hat Fuse
6 6 (1.80%) IBM HTTP Server
6 6 (1.80%) WebSphere
7 4 (1.20%) Camunda
7 4 (1.20%) Confluence
7 4 (1.20%) Oracle HTTP Server
7 4 (1.20%) WebSphere Application Server
8 2 (0.60%) Adobe Experience Manager
8 2 (0.60%) Apache Pig
9 1 (0.30%) Appian
9 1 (0.30%) CMS
9 1 (0.30%) NetWeaver
Applications
1 2 (0.60%) MS Visio
2 1 (0.30%) Microsoft Excel
Business Applications
1 13 (3.90%) Dynamics CRM
2 8 (2.40%) Dynamics AX
3 6 (1.80%) Oracle Cash Management
4 5 (1.50%) BusinessWorks
5 1 (0.30%) SAP S/4HANA
5 1 (0.30%) Sparx Enterprise Architect
Cloud Services
1 170 (51.05%) Serverless
2 61 (18.32%) AWS
3 38 (11.41%) Amazon EC2
4 32 (9.61%) GitHub
5 30 (9.01%) SaaS
6 19 (5.71%) Amazon ECS
7 13 (3.90%) AWS CloudFormation
7 13 (3.90%) Azure
8 11 (3.30%) Amazon S3
8 11 (3.30%) AWS Lambda
8 11 (3.30%) OpenShift
9 10 (3.00%) Amazon SQS
10 9 (2.70%) Amazon EKS
11 8 (2.40%) Dynamics 365
11 8 (2.40%) Power Platform
11 8 (2.40%) PowerApps
12 2 (0.60%) Azure AKS
12 2 (0.60%) Datadog
12 2 (0.60%) IaaS
12 2 (0.60%) PaaS
Communications & Networking
1 4 (1.20%) HTTP
2 1 (0.30%) VLAN
Database & Business Intelligence
1 89 (26.73%) Elasticsearch
2 37 (11.11%) Amazon RDS
3 36 (10.81%) SQL Server
4 29 (8.71%) MySQL
5 16 (4.80%) Relational Database
6 12 (3.60%) PostgreSQL
7 10 (3.00%) Amazon Redshift
8 7 (2.10%) Oracle Database
9 5 (1.50%) SQL Server Integration Services
10 4 (1.20%) Oracle Database 12c
11 3 (0.90%) Big Data
11 3 (0.90%) MongoDB
12 2 (0.60%) Apache Hive
12 2 (0.60%) Data Lake
12 2 (0.60%) Data Warehouse
12 2 (0.60%) Hadoop
12 2 (0.60%) SAP HANA
13 1 (0.30%) DB2
13 1 (0.30%) Metadata
13 1 (0.30%) RDBMS
Development Applications
1 189 (56.76%) Git
2 54 (16.22%) Jenkins
3 35 (10.51%) Maven
4 34 (10.21%) JIRA
5 30 (9.01%) GitLab
6 28 (8.41%) Sonatype Nexus
7 26 (7.81%) IntelliJ
8 14 (4.20%) JUnit
9 10 (3.00%) Artifactory
10 4 (1.20%) SonarQube
11 3 (0.90%) Bitbucket
11 3 (0.90%) Gradle
12 2 (0.60%) Checkstyle
12 2 (0.60%) DbUnit
12 2 (0.60%) IBM UrbanCode
12 2 (0.60%) jMock
12 2 (0.60%) Mockito
12 2 (0.60%) Oracle Forms
12 2 (0.60%) Selenium
12 2 (0.60%) Subversion
General
1 108 (32.43%) Police
2 98 (29.43%) Analytical Skills
2 98 (29.43%) Social Skills
3 31 (9.31%) Finance
4 13 (3.90%) Banking
5 12 (3.60%) Front Office
5 12 (3.60%) Public Sector
6 4 (1.20%) Organisational Skills
7 3 (0.90%) Influencing Skills
7 3 (0.90%) Retail
7 3 (0.90%) Retail Banking
8 2 (0.60%) Inclusion and Diversity
8 2 (0.60%) Law
8 2 (0.60%) Marketing
9 1 (0.30%) Publishing
Job Titles
1 158 (47.45%) Software Engineer
2 154 (46.25%) Java Engineer
3 150 (45.05%) Java Software Engineer
4 94 (28.23%) Senior
5 93 (27.93%) Applications Support
6 92 (27.63%) Analyst
7 88 (26.43%) Applications Support Analyst
7 88 (26.43%) Support Analyst
8 59 (17.72%) Senior Analyst
8 59 (17.72%) Senior Applications Support
8 59 (17.72%) Senior Applications Support Analyst
8 59 (17.72%) Senior Support Analyst
9 53 (15.92%) Developer
10 44 (13.21%) Java Developer
11 35 (10.51%) Senior Developer
12 34 (10.21%) Senior Java Developer
13 26 (7.81%) J2EE Developer
13 26 (7.81%) Java/J2EE Developer
13 26 (7.81%) JavaScript Developer
13 26 (7.81%) Senior J2EE Developer
Libraries, Frameworks & Software Standards
1 263 (78.98%) Spring
2 174 (52.25%) React
3 146 (43.84%) Ruby on Rails
4 89 (26.73%) Java EE
5 42 (12.61%) .NET
6 36 (10.81%) HTML
7 35 (10.51%) CSS
8 27 (8.11%) AngularJS
9 26 (7.81%) jOOQ
9 26 (7.81%) React Native
9 26 (7.81%) Redux
10 23 (6.91%) SOAP
10 23 (6.91%) Spring Boot
11 22 (6.61%) Web Services
12 21 (6.31%) REST
13 13 (3.90%) RESTful
14 11 (3.30%) Apache Camel
14 11 (3.30%) Node.js
15 10 (3.00%) Vue
16 9 (2.70%) Elastic Stack
Miscellaneous
1 29 (8.71%) Self-Motivation
2 10 (3.00%) Distributed Systems
2 10 (3.00%) Tandem
3 6 (1.80%) Enterprise Software
4 4 (1.20%) Clustering
4 4 (1.20%) Management Information System
4 4 (1.20%) Product Ownership
5 3 (0.90%) Low-Code
6 2 (0.60%) Client/Server
6 2 (0.60%) Distributed Computing
6 2 (0.60%) Fixed Income
7 1 (0.30%) Algorithms
7 1 (0.30%) Reinsurance
7 1 (0.30%) Smartphone
Operating Systems
1 88 (26.43%) Unix
2 28 (8.41%) Android
2 28 (8.41%) Windows
3 26 (7.81%) Mac OS
4 15 (4.50%) Linux
5 1 (0.30%) Solaris
Processes & Methodologies
1 268 (80.48%) Problem-Solving
2 236 (70.87%) Containerisation
3 233 (69.97%) Actionable Insight
4 174 (52.25%) Software Engineering
5 173 (51.95%) Microservices
6 157 (47.15%) Mentoring
7 152 (45.65%) Continuous Integration
8 150 (45.05%) Design Patterns
9 148 (44.44%) Coaching
10 147 (44.14%) Code Quality
11 146 (43.84%) Clean Code
11 146 (43.84%) Unit Testing
12 94 (28.23%) ITIL
13 88 (26.43%) Enterprise Architecture
14 87 (26.13%) Impact Assessments
14 87 (26.13%) Incident Management
14 87 (26.13%) Information Management
15 59 (17.72%) Enterprise Search
15 59 (17.72%) Service Management
16 54 (16.22%) Agile
Programming Languages
1 327 (98.20%) Java
2 182 (54.65%) Python
3 181 (54.35%) C#
4 146 (43.84%) Ruby
5 59 (17.72%) Shell Script
6 55 (16.52%) SQL
7 54 (16.22%) JavaScript
8 33 (9.91%) PowerShell
9 27 (8.11%) Bash
10 10 (3.00%) Go
11 6 (1.80%) PL/SQL
12 5 (1.50%) T-SQL
13 3 (0.90%) ABAP
14 2 (0.60%) C
15 1 (0.30%) XPath
15 1 (0.30%) XQuery
Qualifications
1 197 (59.16%) Security Cleared
2 196 (58.86%) SC Cleared
3 44 (13.21%) Degree
4 29 (8.71%) Computer Science Degree
5 5 (1.50%) ITIL Foundation Certificate
6 3 (0.90%) Master's Degree
7 1 (0.30%) AWS Certification
7 1 (0.30%) AWS Certified Cloud Practitioner
7 1 (0.30%) CTC Cleared
Quality Assurance & Compliance
1 87 (26.13%) SLA
2 9 (2.70%) QA
System Software
1 52 (15.62%) Docker
2 4 (1.20%) Oracle RAC
3 2 (0.60%) HDFS
4 1 (0.30%) Virtual Machines
4 1 (0.30%) VMware Infrastructure
4 1 (0.30%) vSphere
Systems Management
1 87 (26.13%) OpenSSO
1 87 (26.13%) Single Sign-On
2 28 (8.41%) AirWatch
3 25 (7.51%) Kubernetes
4 13 (3.90%) Terraform
5 11 (3.30%) Ansible
6 4 (1.20%) Data Guard
6 4 (1.20%) Oracle RMAN
Vendors
1 115 (34.53%) Oracle
2 59 (17.72%) Remedy
3 43 (12.91%) Microsoft
4 12 (3.60%) SAP
5 9 (2.70%) WSO2
6 5 (1.50%) IBM
6 5 (1.50%) TIBCO
7 4 (1.20%) Dynatrace
8 2 (0.60%) Adobe
8 2 (0.60%) Splunk
9 1 (0.30%) Cadence
9 1 (0.30%) Google
9 1 (0.30%) Informatica
9 1 (0.30%) Pega
9 1 (0.30%) Salesforce
9 1 (0.30%) Sony
9 1 (0.30%) Sparx
9 1 (0.30%) VMware