Simple Object Access Protocol (SOAP)
UK

The table below provides summary statistics for permanent job vacancies requiring SOAP skills. It includes a benchmarking guide to the annual salaries offered in vacancies that cited SOAP over the 6 months leading up to 23 October 2024, comparing them to the same period in the previous two years.

6 months to
23 Oct 2024
Same period 2023 Same period 2022
Rank 453 321 356
Rank change year-on-year -132 +35 -91
Permanent jobs citing SOAP 359 585 1,471
As % of all permanent jobs advertised in the UK 0.47% 0.98% 1.05%
As % of the Libraries, Frameworks & Software Standards category 2.50% 3.66% 2.97%
Number of salaries quoted 220 434 801
10th Percentile £38,750 £37,500 £41,000
25th Percentile £42,500 £51,250 £49,500
Median annual salary (50th Percentile) £55,000 £65,000 £62,500
Median % change year-on-year -15.38% +4.00% +13.64%
75th Percentile £71,250 £85,000 £80,250
90th Percentile £81,250 £90,875 £97,500
UK excluding London median annual salary £52,500 £53,500 £55,140
% change year-on-year -1.87% -2.97% +10.28%

All Software Libraries and Frameworks
UK

SOAP falls under the Software Libraries and Frameworks category. For comparison with the information above, the following table provides summary statistics for all permanent job vacancies requiring technical specification, industry standards, software libraries and framework skills.

Permanent vacancies with a requirement for technical specification, industry standards, software libraries and framework skills 14,339 15,963 49,536
As % of all permanent jobs advertised in the UK 18.95% 26.85% 35.25%
Number of salaries quoted 8,546 12,331 25,735
10th Percentile £39,070 £41,250 £40,000
25th Percentile £47,603 £50,750 £48,750
Median annual salary (50th Percentile) £65,000 £65,351 £65,000
Median % change year-on-year -0.54% +0.54% +8.33%
75th Percentile £85,000 £85,000 £85,000
90th Percentile £110,000 £105,000 £102,500
UK excluding London median annual salary £55,000 £57,500 £55,750
% change year-on-year -4.35% +3.14% +11.50%

SOAP
Job Vacancy Trend

Job postings citing SOAP as a proportion of all IT jobs advertised.
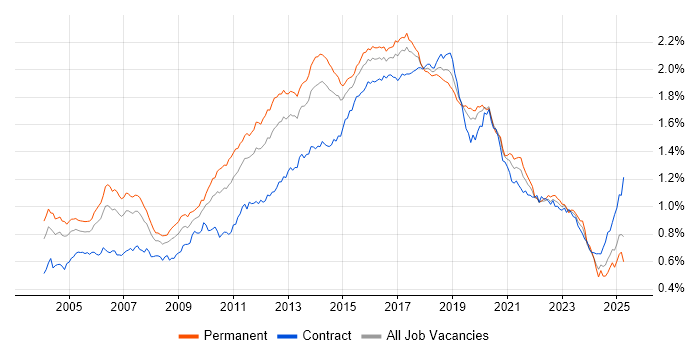
Job vacancy trend for SOAP in the UK

SOAP
Salary Trend

3-month moving average salary quoted in jobs citing SOAP.

Salary trend for SOAP in the UK

SOAP
Salary Histogram

Salary distribution for jobs citing SOAP over the 6 months to 23 October 2024.

Salary histogram for SOAP in the UK

SOAP
Top 16 Job Locations

The table below looks at the demand and provides a guide to the median salaries quoted in IT jobs citing SOAP within the UK over the 6 months to 23 October 2024. The 'Rank Change' column provides an indication of the change in demand within each location based on the same 6 month period last year.

Location Rank Change
on Same Period
Last Year
Matching
Permanent
IT Job Ads
Median Salary
Past 6 Months
Median Salary
% Change
on Same Period
Last Year
Live
Jobs
England -131 328 £55,000 -15.38% 109
UK excluding London -96 258 £52,500 -1.87% 68
Work from Home -98 135 £55,000 -9.09% 261
South East -5 131 £52,500 -1.87% 20
London -98 100 £60,000 -25.00% 47
North of England -75 46 £43,000 -28.33% 19
Midlands -38 32 £50,500 -3.81% 7
North West -43 31 £43,000 -33.85% 14
Scotland -12 23 £68,750 +52.78% 1
East Midlands -22 19 £52,000 -0.95% 4
East of England -43 16 £60,000 +71.43% 7
West Midlands -46 13 £42,500 -20.93% 3
Yorkshire 0 12 £48,750 -11.36% 3
Wales +30 5 £67,500 -3.57% 7
South West -30 5 £47,000 -24.80% 6
North East -27 3 £70,000 +27.27% 2

SOAP
Co-occurring Skills and Capabilities by Category

The follow tables expand on the table above by listing co-occurrences grouped by category. The same employment type, locality and period is covered with up to 20 co-occurrences shown in each of the following categories:

Application Platforms
1 19 (5.29%) SharePoint
2 14 (3.90%) CMS
3 8 (2.23%) WildFly
4 7 (1.95%) Confluence
5 4 (1.11%) IIS
6 3 (0.84%) JBoss
6 3 (0.84%) OpenStack
6 3 (0.84%) Red Hat Fuse
7 2 (0.56%) Oracle SOA Suite
7 2 (0.56%) Oracle Workflow
8 1 (0.28%) Appian
8 1 (0.28%) Microsoft Exchange
8 1 (0.28%) nginx
8 1 (0.28%) Umbraco
8 1 (0.28%) WebSphere
Applications
1 17 (4.74%) Microsoft Excel
2 16 (4.46%) Microsoft PowerPoint
3 5 (1.39%) Photoshop
4 2 (0.56%) MS Visio
5 1 (0.28%) Spreadsheet
Business Applications
1 12 (3.34%) SDL Web 8
2 11 (3.06%) NetSuite
3 10 (2.79%) NEC Housing
4 4 (1.11%) Dynamics CRM
5 2 (0.56%) Payment Gateway
5 2 (0.56%) Remedy ITSM
5 2 (0.56%) SAP Business ByDesign
5 2 (0.56%) SAP ERP
5 2 (0.56%) Temenos T24
6 1 (0.28%) Elite 3E
6 1 (0.28%) Magento
6 1 (0.28%) Oracle Applications
6 1 (0.28%) Oracle EBS
6 1 (0.28%) Oracle ERP
6 1 (0.28%) Oracle Financials
6 1 (0.28%) Sage X3
6 1 (0.28%) SimCorp Dimension
Cloud Services
1 126 (35.10%) Azure
2 66 (18.38%) AWS
3 45 (12.53%) SaaS
4 25 (6.96%) Azure DevOps
5 17 (4.74%) GCP
6 14 (3.90%) Power Platform
7 11 (3.06%) Serverless
8 9 (2.51%) GitHub
9 8 (2.23%) Dynamics 365
10 7 (1.95%) Power Automate
11 6 (1.67%) Boomi
11 6 (1.67%) Kong
12 5 (1.39%) Adobe Creative Cloud
12 5 (1.39%) Apigee
12 5 (1.39%) Azure Logic Apps
12 5 (1.39%) Cloud Computing
12 5 (1.39%) NuGet
12 5 (1.39%) OCI
13 4 (1.11%) Azure Synapse Analytics
13 4 (1.11%) PaaS
Communications & Networking
1 11 (3.06%) HTTP
2 5 (1.39%) SSL
3 4 (1.11%) VPN
4 3 (0.84%) VoIP
5 2 (0.56%) FTP
5 2 (0.56%) Network Security
6 1 (0.28%) 5G
6 1 (0.28%) Broadband
6 1 (0.28%) Firewall
6 1 (0.28%) SSH
6 1 (0.28%) X.509
Database & Business Intelligence
1 73 (20.33%) SQL Server
2 30 (8.36%) MySQL
3 22 (6.13%) SQL Server Integration Services
4 19 (5.29%) OLTP
4 19 (5.29%) Oracle Reports
5 15 (4.18%) Oracle Database
6 11 (3.06%) NoSQL
6 11 (3.06%) Relational Database
6 11 (3.06%) SQL Server Reporting Services
7 10 (2.79%) PostgreSQL
7 10 (2.79%) Power BI
8 7 (1.95%) Data Warehouse
8 7 (1.95%) SQL Server Analysis Services
9 4 (1.11%) Azure SQL Database
9 4 (1.11%) Oracle Database 12c
9 4 (1.11%) Tableau
10 3 (0.84%) DynamoDB
10 3 (0.84%) MongoDB
11 2 (0.56%) Oracle BI Publisher
11 2 (0.56%) Oracle OLAP
Development Applications
1 59 (16.43%) Git
2 41 (11.42%) JIRA
3 39 (10.86%) Visual Studio
4 26 (7.24%) SoapUI
5 25 (6.96%) Postman
6 22 (6.13%) Team Foundation Server
7 18 (5.01%) Jenkins
8 15 (4.18%) Oracle APEX
9 14 (3.90%) GitLab
9 14 (3.90%) Selenium
10 13 (3.62%) TeamCity
11 12 (3.34%) Moq
11 12 (3.34%) NUnit
12 11 (3.06%) JUnit
13 8 (2.23%) SpecFlow
13 8 (2.23%) Subversion
14 7 (1.95%) Cucumber
14 7 (1.95%) Maven
15 6 (1.67%) WebDriver
16 5 (1.39%) Gradle
General
1 155 (43.18%) Social Skills
2 79 (22.01%) Finance
3 47 (13.09%) Law
4 37 (10.31%) Legal
5 36 (10.03%) Analytical Skills
6 23 (6.41%) Banking
6 23 (6.41%) Public Sector
7 14 (3.90%) Marketing
8 12 (3.34%) Local Government
9 11 (3.06%) Retail
10 10 (2.79%) Investment Banking
10 10 (2.79%) Police
11 9 (2.51%) Advertising
12 8 (2.23%) Back Office
13 7 (1.95%) Documentation Skills
14 5 (1.39%) Manufacturing
14 5 (1.39%) Telecoms
15 4 (1.11%) Presentation Skills
16 3 (0.84%) Tech for Good
16 3 (0.84%) Wearables
Job Titles
1 213 (59.33%) Developer
2 63 (17.55%) Senior
3 43 (11.98%) Senior Developer
4 32 (8.91%) Oracle Developer
5 30 (8.36%) Analyst
6 29 (8.08%) Consultant
7 28 (7.80%) Technical Consultant
8 26 (7.24%) Architect
9 23 (6.41%) C# Developer
10 22 (6.13%) Java Developer
11 21 (5.85%) Senior Oracle Developer
11 21 (5.85%) ServiceNow Developer
12 20 (5.57%) Software Developer
12 20 (5.57%) SQL Developer
13 19 (5.29%) .NET Developer
14 16 (4.46%) Full-Stack Developer
14 16 (4.46%) PL/SQL Developer
15 15 (4.18%) Lead
16 14 (3.90%) Java Engineer
17 12 (3.34%) Software Engineer
Libraries, Frameworks & Software Standards
1 234 (65.18%) REST
2 177 (49.30%) HTML
3 145 (40.39%) .NET
4 140 (39.00%) Web Services
5 130 (36.21%) CSS
6 129 (35.93%) XML
7 84 (23.40%) RESTful
8 74 (20.61%) JSON
9 49 (13.65%) ASP.NET
10 41 (11.42%) Spring
11 36 (10.03%) Spring Boot
12 34 (9.47%) .NET Framework
13 31 (8.64%) AngularJS
14 25 (6.96%) jQuery
15 23 (6.41%) React
16 20 (5.57%) WSDL
17 17 (4.74%) Node.js
17 17 (4.74%) Swagger
18 16 (4.46%) ASP.NET MVC
18 16 (4.46%) XSD
Miscellaneous
1 47 (13.09%) Legacy Systems
2 41 (11.42%) Greenfield Project
3 18 (5.01%) PropTech
4 12 (3.34%) Legacy Code
5 11 (3.06%) Enterprise Software
5 11 (3.06%) NHS
6 8 (2.23%) CMDB
6 8 (2.23%) Management Information System
6 8 (2.23%) Product Ownership
6 8 (2.23%) Self-Motivation
7 6 (1.67%) Cloud Native
7 6 (1.67%) Market Risk
8 5 (1.39%) Low-Code
9 4 (1.11%) Distributed Systems
9 4 (1.11%) Mobile App
10 3 (0.84%) Data Structures
10 3 (0.84%) Renewable Energy
10 3 (0.84%) Smartphone
11 2 (0.56%) Data Centre
11 2 (0.56%) Onboarding
Operating Systems
1 21 (5.85%) Linux
2 20 (5.57%) Windows
3 6 (1.67%) Android
4 5 (1.39%) Unix
5 4 (1.11%) Apple iOS
6 2 (0.56%) Windows 10
7 1 (0.28%) AIX
7 1 (0.28%) Ubuntu
7 1 (0.28%) VMS
7 1 (0.28%) Windows Server
Processes & Methodologies
1 131 (36.49%) Problem-Solving
2 102 (28.41%) Agile
3 53 (14.76%) Migration
4 52 (14.48%) Mentoring
5 51 (14.21%) DevOps
6 48 (13.37%) Computer Science
7 47 (13.09%) Test Automation
8 44 (12.26%) Software Testing
9 43 (11.98%) Data Migration
10 40 (11.14%) Analytics
10 40 (11.14%) CI/CD
11 39 (10.86%) API Integration
12 37 (10.31%) API Development
13 35 (9.75%) Full-Stack Development
13 35 (9.75%) OO
14 33 (9.19%) Scrum
15 32 (8.91%) Data Modelling
15 32 (8.91%) Performance Tuning
15 32 (8.91%) Software Engineering
16 30 (8.36%) ETL
Programming Languages
1 195 (54.32%) SQL
2 180 (50.14%) JavaScript
3 142 (39.55%) C#
4 85 (23.68%) Java
5 51 (14.21%) T-SQL
6 35 (9.75%) PL/SQL
6 35 (9.75%) Python
7 17 (4.74%) PowerShell
8 13 (3.62%) C
8 13 (3.62%) PHP
8 13 (3.62%) TypeScript
9 11 (3.06%) Ruby
10 9 (2.51%) VB.NET
11 7 (1.95%) Apex Code
12 6 (1.67%) C++
12 6 (1.67%) XAML
12 6 (1.67%) XPath
13 2 (0.56%) ABAP
13 2 (0.56%) Perl
13 2 (0.56%) VB6
Qualifications
1 68 (18.94%) Degree
2 26 (7.24%) Computer Science Degree
3 25 (6.96%) Security Cleared
4 11 (3.06%) SC Cleared
5 10 (2.79%) DBS Check
6 7 (1.95%) ISTQB
7 6 (1.67%) ISTQB Advanced Certification
8 5 (1.39%) DV Cleared
9 4 (1.11%) Master's Degree
10 3 (0.84%) Microsoft Certification
11 2 (0.56%) AWS Certification
11 2 (0.56%) TOGAF Certification
12 1 (0.28%) Azure Certification
12 1 (0.28%) PMI Certification
12 1 (0.28%) PMP
Quality Assurance & Compliance
1 19 (5.29%) Accessibility
2 18 (5.01%) QA
3 8 (2.23%) SLA
4 4 (1.11%) HL7
5 2 (0.56%) GRC
5 2 (0.56%) WCAG
6 1 (0.28%) Data Quality
6 1 (0.28%) GDPR
6 1 (0.28%) ISO 15022
6 1 (0.28%) ISO 20022
System Software
1 23 (6.41%) Docker
2 4 (1.11%) Virtual Machines
2 4 (1.11%) vSphere
3 2 (0.56%) Active Directory
3 2 (0.56%) Firmware
Systems Management
1 24 (6.69%) Kubernetes
2 5 (1.39%) Single Sign-On
3 3 (0.84%) Ansible
4 2 (0.56%) Grafana
4 2 (0.56%) Kibana
4 2 (0.56%) Terraform
5 1 (0.28%) HP UCMDB
5 1 (0.28%) logstash
5 1 (0.28%) Progress Chef
5 1 (0.28%) Prometheus
Vendors
1 68 (18.94%) Oracle
2 66 (18.38%) Microsoft
3 30 (8.36%) ServiceNow
4 14 (3.90%) Salesforce
5 10 (2.79%) Google
5 10 (2.79%) NEC
6 9 (2.51%) Adobe
7 7 (1.95%) MuleSoft
7 7 (1.95%) SAP
8 5 (1.39%) Cognizant
8 5 (1.39%) Sybase
9 4 (1.11%) Databricks
10 3 (0.84%) New Relic
10 3 (0.84%) SnapLogic
10 3 (0.84%) webMethods
10 3 (0.84%) WSO2
11 2 (0.56%) CyberTech
11 2 (0.56%) Pega
11 2 (0.56%) Talend
11 2 (0.56%) TSYS