Shell Scripting (Shell Programming)
UK

The following table provides summary statistics for permanent job vacancies with a requirement for Shell Script skills. Included is a benchmarking guide to the salaries offered in vacancies that have cited Shell Script over the 6 months to 29 November 2023 with a comparison to the same period in the previous 2 years.

6 months to
29 Nov 2023
Same period 2022 Same period 2021
Rank 434 535 413
Rank change year-on-year +101 -122 -77
Permanent jobs citing Shell Script 320 710 1,044
As % of all permanent jobs advertised in the UK 0.59% 0.56% 0.81%
As % of the Programming Languages category 1.46% 1.23% 1.55%
Number of salaries quoted 200 396 494
10th Percentile £42,475 £39,625 £39,000
25th Percentile £50,938 £42,611 £45,750
Median annual salary (50th Percentile) £68,000 £60,000 £60,000
Median % change year-on-year +13.33% - -
75th Percentile £80,000 £76,250 £75,000
90th Percentile £90,000 £90,000 £93,375
UK excluding London median annual salary £60,000 £50,000 £52,500
% change year-on-year +20.00% -4.76% +9.38%

All Programming Languages
UK

Shell Script is in the Programming Languages category. The following table is for comparison with the above and provides summary statistics for all permanent job vacancies with a requirement for coding skills.

Permanent vacancies with a requirement for coding skills 21,953 57,743 67,492
As % of all permanent jobs advertised in the UK 40.57% 45.89% 52.29%
Number of salaries quoted 17,206 36,754 45,306
10th Percentile £39,750 £38,250 £36,250
25th Percentile £48,000 £47,500 £45,000
Median annual salary (50th Percentile) £65,000 £65,000 £60,000
Median % change year-on-year - +8.33% +9.09%
75th Percentile £85,000 £85,000 £80,000
90th Percentile £105,000 £102,500 £97,500
UK excluding London median annual salary £55,000 £55,000 £50,000
% change year-on-year - +10.00% -

Shell Script
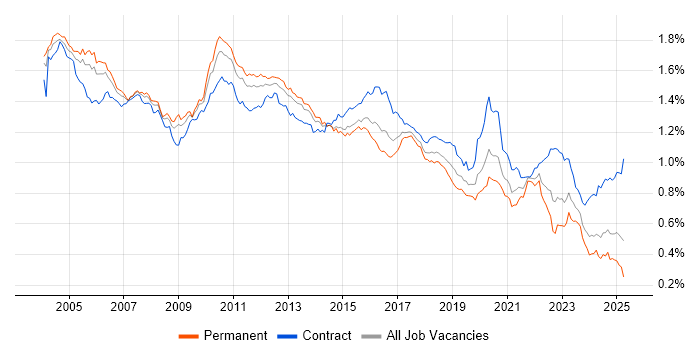
Job Vacancy Trend

Job postings citing Shell Script as a proportion of all IT jobs advertised.

Job vacancy trend for Shell Script in the UK

Shell Script
Salary Trend

3-month moving average salary quoted in jobs citing Shell Script.

Salary trend for Shell Script in the UK

Shell Script
Salary Histogram

Salary distribution for jobs citing Shell Script over the 6 months to 29 November 2023.

Salary histogram for Shell Script in the UK

Shell Script
Top 16 Job Locations

The table below looks at the demand and provides a guide to the median salaries quoted in IT jobs citing Shell Script within the UK over the 6 months to 29 November 2023. The 'Rank Change' column provides an indication of the change in demand within each location based on the same 6 month period last year.

Location Rank Change
on Same Period
Last Year
Matching
Permanent
IT Job Ads
Median Salary
Past 6 Months
Median Salary
% Change
on Same Period
Last Year
Live
Jobs
England +64 237 £67,500 +13.45% 111
UK excluding London +108 203 £60,000 +20.00% 67
Work from Home +157 109 £68,000 +17.24% 52
London +79 93 £75,000 +15.38% 57
South East +116 64 £64,250 +28.50% 20
South West +53 34 £55,000 +46.67% 17
Wales +41 34 £41,000 -2.67% 1
Scotland +37 30 £70,576 +21.68% 6
North of England +113 26 £55,000 -6.38% 11
Yorkshire +91 18 £55,000 -15.38% 3
East of England +75 12 £72,500 +0.69% 7
North West +96 8 £54,500 +40.73% 7
Midlands +111 7 £55,000 +35.80% 5
West Midlands +103 4 £53,750 +33.54% 4
Northern Ireland +34 4 £100,000 +100.00% 2
East Midlands +46 3 £60,000 +20.00% 1

Shell Script
Co-occurring Skills and Capabilities by Category

The follow tables expand on the table above by listing co-occurrences grouped by category. The same employment type, locality and period is covered with up to 20 co-occurrences shown in each of the following categories:

Application Platforms
1 71 (22.19%) WebLogic
2 28 (8.75%) Apache
3 22 (6.88%) nginx
4 14 (4.38%) Apache Spark
4 14 (4.38%) Jupyter
5 10 (3.13%) Oracle SOA Suite
6 7 (2.19%) Apache Airflow
6 7 (2.19%) Tomcat
7 6 (1.88%) IIS
8 3 (0.94%) Confluence
8 3 (0.94%) SAS
8 3 (0.94%) SharePoint
9 2 (0.63%) MODX
9 2 (0.63%) MS Exchange
9 2 (0.63%) OpenStack
9 2 (0.63%) Oracle Workflow
9 2 (0.63%) Site Server
9 2 (0.63%) WordPress
10 1 (0.31%) Luigi
Applications
1 5 (1.56%) Microsoft Office
2 3 (0.94%) Microsoft Excel
2 3 (0.94%) Microsoft PowerPoint
Business Applications
1 3 (0.94%) Payment Gateway
2 2 (0.63%) Salesforce CRM
3 1 (0.31%) Remedy ITSM
Cloud Services
1 96 (30.00%) AWS
2 44 (13.75%) Azure
3 40 (12.50%) Serverless
4 36 (11.25%) Amazon S3
5 33 (10.31%) AWS Lambda
5 33 (10.31%) OpenShift
6 30 (9.38%) AWS CloudFormation
7 25 (7.81%) Amazon EKS
8 22 (6.88%) Amazon EC2
9 20 (6.25%) SaaS
10 16 (5.00%) MinIO
11 14 (4.38%) Azure DevOps
11 14 (4.38%) GitHub
11 14 (4.38%) IaaS
11 14 (4.38%) PaaS
12 12 (3.75%) AWS CodeBuild
13 8 (2.50%) Amazon CloudWatch
13 8 (2.50%) GCP
13 8 (2.50%) Virtual Private Cloud
14 7 (2.19%) Amazon ECS
Communications & Networking
1 18 (5.63%) DNS
2 10 (3.13%) Firewall
3 8 (2.50%) HTTP
4 7 (2.19%) FTP
5 6 (1.88%) Internet
5 6 (1.88%) OpenVPN
5 6 (1.88%) VPN
6 4 (1.25%) TCP/IP
7 3 (0.94%) IPv6
7 3 (0.94%) Kerberos
7 3 (0.94%) Network Security
7 3 (0.94%) SAN
7 3 (0.94%) SpaceWire
7 3 (0.94%) WAN
8 2 (0.63%) BGP
8 2 (0.63%) IP Telephony
8 2 (0.63%) LAN
8 2 (0.63%) Wireless
9 1 (0.31%) HTTPS
9 1 (0.31%) SS7
Database & Business Intelligence
1 63 (19.69%) Elasticsearch
2 24 (7.50%) Big Data
3 22 (6.88%) MongoDB
3 22 (6.88%) SQL Server
4 20 (6.25%) MySQL
5 19 (5.94%) Relational Database
6 18 (5.63%) Hadoop
7 16 (5.00%) Data Warehouse
7 16 (5.00%) NoSQL
8 14 (4.38%) Oracle Database
8 14 (4.38%) PostgreSQL
9 12 (3.75%) Amazon Athena
9 12 (3.75%) DynamoDB
9 12 (3.75%) Presto
10 10 (3.13%) Oracle ODI
10 10 (3.13%) Oracle Reports
11 9 (2.81%) Amazon RDS
12 6 (1.88%) KDB
13 5 (1.56%) Hazelcast
13 5 (1.56%) Power BI
Development Applications
1 84 (26.25%) Jenkins
2 81 (25.31%) Git
3 30 (9.38%) CircleCI
4 25 (7.81%) Atlassian Bamboo
4 25 (7.81%) JIRA
5 18 (5.63%) git-flow
6 16 (5.00%) Maven
7 15 (4.69%) GitLab
7 15 (4.69%) Travis CI
8 14 (4.38%) Cucumber
9 13 (4.06%) SonarQube
10 10 (3.13%) Artifactory
10 10 (3.13%) Oracle Forms
11 8 (2.50%) Gradle
12 5 (1.56%) JUnit
12 5 (1.56%) Postman
12 5 (1.56%) Serilog
13 4 (1.25%) Bitbucket
14 3 (0.94%) Ranorex
14 3 (0.94%) WebDriver
General
1 107 (33.44%) Social Skills
2 75 (23.44%) Analytical Skills
3 55 (17.19%) Finance
4 17 (5.31%) Public Sector
5 14 (4.38%) Banking
6 11 (3.44%) Inclusion and Diversity
7 9 (2.81%) Advertising
8 6 (1.88%) Financial Institution
9 4 (1.25%) Aerospace
9 4 (1.25%) Law
9 4 (1.25%) Marketing
9 4 (1.25%) Retail
10 3 (0.94%) Documentation Skills
10 3 (0.94%) Front Office
10 3 (0.94%) Retail Banking
10 3 (0.94%) Telecoms
11 2 (0.63%) Aviation
11 2 (0.63%) Military
11 2 (0.63%) Presentation Skills
12 1 (0.31%) Electronics
Job Titles
1 100 (31.25%) Senior
2 71 (22.19%) Analyst
3 70 (21.88%) Applications Support
4 67 (20.94%) Applications Support Analyst
4 67 (20.94%) Support Analyst
5 62 (19.38%) DevOps Engineer
6 61 (19.06%) Senior Analyst
6 61 (19.06%) Senior Applications Support
6 61 (19.06%) Senior Applications Support Analyst
6 61 (19.06%) Senior Support Analyst
7 29 (9.06%) Cloud Engineer
8 28 (8.75%) Developer
9 23 (7.19%) Administrator
10 19 (5.94%) Data Engineer
11 16 (5.00%) Systems Administrator
12 15 (4.69%) Support Engineer
13 14 (4.38%) Lead
13 14 (4.38%) Senior Developer
14 13 (4.06%) Platform Engineer
15 12 (3.75%) DevOps Manager
Libraries, Frameworks & Software Standards
1 73 (22.81%) Spring
2 61 (19.06%) Java EE
3 59 (18.44%) J2EE
4 35 (10.94%) Elastic Stack
5 33 (10.31%) REST
5 33 (10.31%) YAML
6 26 (8.13%) JSON
7 22 (6.88%) RabbitMQ
8 14 (4.38%) Spring Boot
9 12 (3.75%) ActiveMQ
9 12 (3.75%) Apache NiFi
9 12 (3.75%) HTML
9 12 (3.75%) Kafka
10 11 (3.44%) Flask
10 11 (3.44%) XML
11 10 (3.13%) React
11 10 (3.13%) RESTful
12 9 (2.81%) LDAP
13 8 (2.50%) Node.js
14 7 (2.19%) Web Services
Miscellaneous
1 22 (6.88%) Distributed Systems
2 14 (4.38%) Hybrid Cloud
3 13 (4.06%) Onboarding
4 9 (2.81%) Management Information System
4 9 (2.81%) Public Cloud
5 8 (2.50%) Linux Command Line
6 7 (2.19%) Self-Motivation
7 6 (1.88%) Cloud Native
7 6 (1.88%) Mainframe
8 5 (1.56%) Data Centre
8 5 (1.56%) Virtual Team
9 4 (1.25%) Algorithms
9 4 (1.25%) Product Ownership
9 4 (1.25%) Video\Live Streaming
10 3 (0.94%) Blockchain
10 3 (0.94%) Data Protection Act
10 3 (0.94%) Embedded Systems
11 2 (0.63%) Distributed Applications
11 2 (0.63%) Social Media
11 2 (0.63%) Team-Oriented Environment
Operating Systems
1 190 (59.38%) Linux
2 137 (42.81%) Unix
3 56 (17.50%) Windows
4 30 (9.38%) Red Hat Enterprise Linux
5 18 (5.63%) CentOS
5 18 (5.63%) Ubuntu
6 17 (5.31%) Windows Server
7 7 (2.19%) Solaris
8 6 (1.88%) Debian
8 6 (1.88%) Mac OS
9 3 (0.94%) VxWorks
10 2 (0.63%) Windows Server 2012
10 2 (0.63%) Windows Server 2016
10 2 (0.63%) Windows Server 2019
11 1 (0.31%) AIX
11 1 (0.31%) Android
Processes & Methodologies
1 126 (39.38%) DevOps
2 111 (34.69%) CI/CD
3 105 (32.81%) Problem-Solving
4 103 (32.19%) Containerisation
5 87 (27.19%) Agile
6 76 (23.75%) ITIL
7 63 (19.69%) Actionable Insight
7 63 (19.69%) Incident Management
7 63 (19.69%) Service Management
8 62 (19.38%) Infrastructure as Code
9 61 (19.06%) Enterprise Architecture
10 60 (18.75%) Information Management
11 59 (18.44%) Enterprise Search
11 59 (18.44%) Impact Assessments
12 53 (16.56%) Software Engineering
13 48 (15.00%) Microservices
14 42 (13.13%) Configuration Management
15 35 (10.94%) Continuous Integration
16 29 (9.06%) Deployment Automation
17 24 (7.50%) Data Engineering
Programming Languages
1 141 (44.06%) Python
2 136 (42.50%) Java
3 87 (27.19%) SQL
4 56 (17.50%) Bash
5 26 (8.13%) PowerShell
6 25 (7.81%) JavaScript
7 22 (6.88%) PHP
8 20 (6.25%) Perl
9 19 (5.94%) Groovy
10 18 (5.63%) C++
11 15 (4.69%) C
12 13 (4.06%) C#
13 12 (3.75%) PL/SQL
14 9 (2.81%) Ruby
15 8 (2.50%) Go
16 5 (1.56%) Scala
17 3 (0.94%) Korn
18 2 (0.63%) COBOL
18 2 (0.63%) REXX
18 2 (0.63%) XPath
Qualifications
1 95 (29.69%) Security Cleared
2 76 (23.75%) SC Cleared
3 28 (8.75%) Degree
4 14 (4.38%) Computer Science Degree
5 13 (4.06%) DV Cleared
6 8 (2.50%) Azure Certification
7 7 (2.19%) AWS Certification
8 6 (1.88%) BPSS Clearance
9 4 (1.25%) ISTQB
9 4 (1.25%) ITIL Certification
9 4 (1.25%) Microsoft Certification
10 3 (0.94%) Master's Degree
10 3 (0.94%) MCP
11 2 (0.63%) AWS Certified DevOps Engineer
11 2 (0.63%) MCSE
12 1 (0.31%) AWS Certified Solutions Architect
12 1 (0.31%) Numerate Degree
Quality Assurance & Compliance
1 61 (19.06%) SLA
2 13 (4.06%) QA
3 2 (0.63%) Accessibility
3 2 (0.63%) ISO 9001
3 2 (0.63%) ISO/IEC 27001
4 1 (0.31%) ECSS
4 1 (0.31%) JTAG
System Software
1 101 (31.56%) Docker
2 17 (5.31%) Active Directory
3 12 (3.75%) VMware Infrastructure
4 5 (1.56%) Apache ZooKeeper
4 5 (1.56%) Oracle RAC
5 4 (1.25%) Ceph
5 4 (1.25%) Hyper-V
6 3 (0.94%) Shibboleth
7 2 (0.63%) Virtual Machines
7 2 (0.63%) VMware ESXi
8 1 (0.31%) Firmware
8 1 (0.31%) KVM
Systems Management
1 98 (30.63%) Kubernetes
2 97 (30.31%) Ansible
3 92 (28.75%) Terraform
4 59 (18.44%) OpenSSO
4 59 (18.44%) Single Sign-On
5 22 (6.88%) Prometheus
6 19 (5.94%) Grafana
7 15 (4.69%) Puppet
8 14 (4.38%) HAProxy
9 11 (3.44%) Packer
10 10 (3.13%) Progress Chef
11 6 (1.88%) Jamf Pro
12 5 (1.56%) Oracle RMAN
13 4 (1.25%) Data Guard
13 4 (1.25%) Docker Swarm
14 3 (0.94%) Rancher
14 3 (0.94%) Rsyslog
15 2 (0.63%) Kibana
15 2 (0.63%) logstash
15 2 (0.63%) ZABBIX
Vendors
1 100 (31.25%) Oracle
2 60 (18.75%) Remedy
3 23 (7.19%) Microsoft
3 23 (7.19%) Red Hat
4 22 (6.88%) VMware
5 18 (5.63%) Splunk
6 12 (3.75%) Google
7 11 (3.44%) IBM
8 10 (3.13%) Atlassian
8 10 (3.13%) Hyperion
9 8 (2.50%) AppDynamics
10 7 (2.19%) McAfee
11 6 (1.88%) ServiceNow
11 6 (1.88%) Zscaler
12 5 (1.56%) Solace
13 4 (1.25%) Veritas
14 3 (0.94%) CrowdStrike
14 3 (0.94%) Salesforce
14 3 (0.94%) Sybase
15 2 (0.63%) Okta