NoSQL
UK

The table below provides summary statistics for permanent job vacancies requiring NoSQL skills. It includes a benchmarking guide to the annual salaries offered in vacancies that cited NoSQL over the 6 months leading up to 15 March 2025, comparing them to the same period in the previous two years.

6 months to
15 Mar 2025
Same period 2024 Same period 2023
Rank 249 180 147
Rank change year-on-year -69 -33 -48
Permanent jobs citing NoSQL 653 1,522 2,677
As % of all permanent jobs advertised in the UK 1.20% 1.74% 2.41%
As % of the Database & Business Intelligence category 7.66% 9.06% 10.99%
Number of salaries quoted 394 902 1,364
10th Percentile £47,500 £42,500 £46,250
25th Percentile £56,250 £52,500 £55,000
Median annual salary (50th Percentile) £70,000 £67,500 £75,000
Median % change year-on-year +3.70% -10.00% +7.14%
75th Percentile £85,000 £90,000 £95,000
90th Percentile £100,000 £105,000 £112,500
UK excluding London median annual salary £62,500 £62,500 £65,000
% change year-on-year - -3.85% +8.33%

All Database and Business Intelligence Skills
UK

NoSQL falls under the Databases and Business Intelligence category. For comparison with the information above, the following table provides summary statistics for all permanent job vacancies requiring database or business intelligence skills.

Permanent vacancies with a requirement for database or business intelligence skills 8,526 16,805 24,359
As % of all permanent jobs advertised in the UK 15.69% 19.22% 21.93%
Number of salaries quoted 5,310 12,210 14,919
10th Percentile £37,500 £35,000 £37,484
25th Percentile £47,500 £42,750 £47,500
Median annual salary (50th Percentile) £62,500 £57,500 £62,500
Median % change year-on-year +8.70% -8.00% +4.17%
75th Percentile £85,000 £75,000 £83,750
90th Percentile £115,000 £95,000 £102,500
UK excluding London median annual salary £55,000 £52,500 £55,000
% change year-on-year +4.76% -4.55% +10.00%

NoSQL
Job Vacancy Trend

Job postings citing NoSQL as a proportion of all IT jobs advertised.
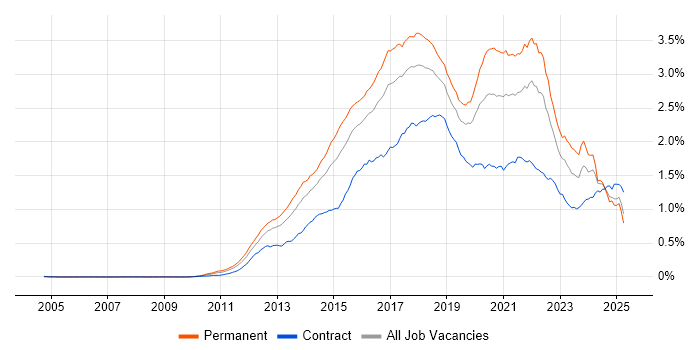
Job vacancy trend for NoSQL in the UK

NoSQL
Salary Trend

3-month moving average salary quoted in jobs citing NoSQL.

Salary trend for NoSQL in the UK

NoSQL
Salary Histogram

Salary distribution for jobs citing NoSQL over the 6 months to 15 March 2025.

Salary histogram for NoSQL in the UK

NoSQL
Top 17 Job Locations

The table below looks at the demand and provides a guide to the median salaries quoted in IT jobs citing NoSQL within the UK over the 6 months to 15 March 2025. The 'Rank Change' column provides an indication of the change in demand within each location based on the same 6 month period last year.

Location Rank Change
on Same Period
Last Year
Matching
Permanent
IT Job Ads
Median Salary
Past 6 Months
Median Salary
% Change
on Same Period
Last Year
Live
Jobs
England -17 609 £70,000 +3.70% 715
UK excluding London -92 381 £62,500 - 287
Work from Home +36 296 £62,500 -4.53% 376
London +8 252 £82,500 +3.13% 473
South East +21 146 £62,500 -16.67% 67
North of England -16 94 £67,500 +10.28% 91
Midlands +6 59 £60,603 +1.01% 41
North West -27 47 £63,750 +4.16% 68
Yorkshire +53 45 £71,991 +9.97% 15
South West +10 34 £72,500 +31.82% 27
East Midlands +21 31 £62,500 +13.64% 12
West Midlands -17 28 £60,000 -1.97% 29
Scotland -113 26 £60,000 -1.64% 31
East of England +31 16 £50,750 -18.80% 21
Wales +45 7 £47,307 -21.16% 3
North East +13 2 £61,206 - 8
Northern Ireland +28 1 £85,000 -10.53% 13

NoSQL
Co-occurring Skills and Capabilities by Category

The follow tables expand on the table above by listing co-occurrences grouped by category. The same employment type, locality and period is covered with up to 20 co-occurrences shown in each of the following categories:

Application Platforms
1 67 (10.26%) Apache Spark
2 38 (5.82%) Apache Airflow
3 27 (4.13%) Apache
4 20 (3.06%) SAS
5 16 (2.45%) Confluence
6 13 (1.99%) nginx
7 12 (1.84%) Apache Solr
8 5 (0.77%) SharePoint
9 4 (0.61%) Cloud Foundry
9 4 (0.61%) CMS
9 4 (0.61%) GemFire
9 4 (0.61%) OpenStack
10 3 (0.46%) Ethereum
11 2 (0.31%) Appian
11 2 (0.31%) Jupyter
11 2 (0.31%) Microsoft Exchange
11 2 (0.31%) Tomcat
11 2 (0.31%) WebSphere
11 2 (0.31%) WebSphere Application Server
12 1 (0.15%) WordPress
Applications
1 9 (1.38%) Microsoft Office
2 3 (0.46%) Chatbot
2 3 (0.46%) Microsoft Excel
3 2 (0.31%) MS Visio
4 1 (0.15%) Microsoft Project
4 1 (0.15%) Trello
Business Applications
1 2 (0.31%) Endur
2 1 (0.15%) SAP Business One
Cloud Services
1 313 (47.93%) AWS
2 253 (38.74%) Azure
3 153 (23.43%) GCP
4 72 (11.03%) SaaS
5 66 (10.11%) Serverless
6 63 (9.65%) Amazon S3
7 46 (7.04%) Amazon EC2
8 42 (6.43%) GitHub
9 41 (6.28%) AWS Lambda
10 33 (5.05%) AWS CloudFormation
11 30 (4.59%) Azure Cosmos DB
12 27 (4.13%) Power Platform
13 26 (3.98%) Azure DevOps
14 24 (3.68%) Snowflake
15 19 (2.91%) Azure Functions
16 18 (2.76%) Cloud Computing
17 17 (2.60%) GitHub Actions
17 17 (2.60%) OpenShift
18 16 (2.45%) Azure Synapse Analytics
18 16 (2.45%) dbt
Communications & Networking
1 15 (2.30%) DNS
1 15 (2.30%) TCP/IP
2 12 (1.84%) HTTPS
2 12 (1.84%) IPsec
3 10 (1.53%) Internet
4 5 (0.77%) Firewall
4 5 (0.77%) HTTP
4 5 (0.77%) VPN
5 3 (0.46%) MQTT
6 2 (0.31%) Cisco Nexus
6 2 (0.31%) FCoE
6 2 (0.31%) Fibre Channel
6 2 (0.31%) iSCSI
6 2 (0.31%) LAN
6 2 (0.31%) Multicast
6 2 (0.31%) NAS
6 2 (0.31%) SAN
6 2 (0.31%) WAN
7 1 (0.15%) Intranet
7 1 (0.15%) VoIP
Database & Business Intelligence
1 156 (23.89%) MongoDB
2 98 (15.01%) SQL Server
3 90 (13.78%) PostgreSQL
4 88 (13.48%) Data Warehouse
5 77 (11.79%) MySQL
6 61 (9.34%) Relational Database
7 57 (8.73%) Big Data
8 53 (8.12%) DynamoDB
9 40 (6.13%) Elasticsearch
10 39 (5.97%) Amazon Redshift
11 38 (5.82%) Redis
12 37 (5.67%) Data Lake
13 36 (5.51%) Hadoop
14 31 (4.75%) Tableau
15 28 (4.29%) RDBMS
16 26 (3.98%) Apache Hive
17 24 (3.68%) Couchbase
18 23 (3.52%) Power BI
19 19 (2.91%) Amazon RDS
20 17 (2.60%) Apache Cassandra
Development Applications
1 159 (24.35%) Git
2 84 (12.86%) Jenkins
3 38 (5.82%) GitLab
3 38 (5.82%) JIRA
4 35 (5.36%) JUnit
5 32 (4.90%) Mockito
6 28 (4.29%) Selenium
7 25 (3.83%) Cypress.io
8 24 (3.68%) Maven
9 23 (3.52%) Jasmine
9 23 (3.52%) Karma Test Runner
10 22 (3.37%) Eclipse
10 22 (3.37%) IntelliJ
10 22 (3.37%) Protractor
11 18 (2.76%) Bitbucket
12 16 (2.45%) TeamCity
13 15 (2.30%) SoapUI
14 14 (2.14%) Gradle
15 13 (1.99%) Octopus Deploy
16 12 (1.84%) Sonatype Nexus
General
1 191 (29.25%) Social Skills
2 190 (29.10%) Finance
3 77 (11.79%) Banking
4 57 (8.73%) Law
5 55 (8.42%) Analytical Skills
6 34 (5.21%) Public Sector
7 30 (4.59%) Inclusion and Diversity
8 25 (3.83%) Front Office
9 22 (3.37%) Games
10 21 (3.22%) Manufacturing
11 19 (2.91%) Influencing Skills
12 18 (2.76%) Marketing
13 16 (2.45%) Electronics
14 13 (1.99%) Legal
15 12 (1.84%) Automotive
15 12 (1.84%) Retail
15 12 (1.84%) Telecoms
16 10 (1.53%) Tech for Good
17 9 (1.38%) Agriculture
17 9 (1.38%) Retail Banking
Job Titles
1 239 (36.60%) Developer
2 204 (31.24%) Senior
3 96 (14.70%) Software Engineer
4 91 (13.94%) Lead
5 86 (13.17%) Architect
6 77 (11.79%) Senior Developer
7 48 (7.35%) Software Developer
8 47 (7.20%) Data Engineer
9 46 (7.04%) Java Developer
10 41 (6.28%) Solutions Architect
11 39 (5.97%) Backend Developer
12 38 (5.82%) .NET Developer
12 38 (5.82%) Senior Software Engineer
13 36 (5.51%) Full-Stack Developer
14 33 (5.05%) Python Engineer
15 28 (4.29%) AWS Engineer
16 27 (4.13%) Data Architect
17 25 (3.83%) Senior Software Developer
18 24 (3.68%) C# Developer
18 24 (3.68%) Python Developer
Libraries, Frameworks & Software Standards
1 191 (29.25%) React
2 155 (23.74%) .NET
3 118 (18.07%) RESTful
4 117 (17.92%) Kafka
5 102 (15.62%) RabbitMQ
6 97 (14.85%) REST
7 71 (10.87%) Node.js
8 70 (10.72%) AngularJS
9 61 (9.34%) CSS
10 57 (8.73%) GraphQL
11 55 (8.42%) HTML
12 52 (7.96%) Spring
13 40 (6.13%) Spring Boot
14 34 (5.21%) .NET Core
15 31 (4.75%) .NET Framework
16 29 (4.44%) Hibernate
16 29 (4.44%) HTML5
17 28 (4.29%) Vue
18 25 (3.83%) Entity Framework
18 25 (3.83%) Redux
Miscellaneous
1 74 (11.33%) Cloud Native
2 69 (10.57%) Algorithms
3 43 (6.58%) Product Ownership
4 34 (5.21%) Data Structures
5 32 (4.90%) Distributed Systems
6 31 (4.75%) Legacy Systems
7 30 (4.59%) Management Information System
8 27 (4.13%) Greenfield Project
9 18 (2.76%) Enterprise Software
9 18 (2.76%) IoT
9 18 (2.76%) Legacy Code
10 17 (2.60%) Mobile Games
11 15 (2.30%) Distributed Applications
12 12 (1.84%) Public Cloud
13 10 (1.53%) Mobile App
14 9 (1.38%) Blockchain
14 9 (1.38%) Derivative
15 8 (1.23%) Linux Command Line
16 7 (1.07%) Legacy Applications
16 7 (1.07%) Self-Motivation
Operating Systems
1 61 (9.34%) Linux
2 25 (3.83%) Unix
3 18 (2.76%) Windows
4 17 (2.60%) Apple iOS
5 14 (2.14%) Android
6 5 (0.77%) Robot Operating System
7 3 (0.46%) Ubuntu
8 2 (0.31%) Embedded Linux
8 2 (0.31%) Solaris
8 2 (0.31%) Windows Server
9 1 (0.15%) Debian
9 1 (0.15%) Windows 10
9 1 (0.15%) Windows Server 2012
Processes & Methodologies
1 312 (47.78%) Agile
2 246 (37.67%) Microservices
3 242 (37.06%) CI/CD
4 216 (33.08%) Software Engineering
5 173 (26.49%) DevOps
6 151 (23.12%) Containerisation
7 143 (21.90%) Problem-Solving
8 130 (19.91%) Mentoring
9 121 (18.53%) ETL
10 110 (16.85%) Data Modelling
11 103 (15.77%) Machine Learning
11 103 (15.77%) TDD
12 101 (15.47%) Computer Science
13 98 (15.01%) Analytics
14 97 (14.85%) Artificial Intelligence
15 93 (14.24%) Test Automation
16 90 (13.78%) Unit Testing
17 86 (13.17%) Full-Stack Development
18 85 (13.02%) Event-Driven
19 78 (11.94%) Data Pipeline
Programming Languages
1 397 (60.80%) SQL
2 237 (36.29%) Python
3 177 (27.11%) JavaScript
4 173 (26.49%) Java
5 158 (24.20%) C#
6 117 (17.92%) TypeScript
7 32 (4.90%) Go
8 27 (4.13%) R
8 27 (4.13%) Scala
9 22 (3.37%) PHP
10 19 (2.91%) MATLAB
11 18 (2.76%) Bash
12 13 (1.99%) T-SQL
13 12 (1.84%) C++
14 10 (1.53%) Bicep
15 7 (1.07%) PowerShell
15 7 (1.07%) Ruby
16 5 (0.77%) PL/SQL
16 5 (0.77%) Shell Script
17 3 (0.46%) Solidity
Qualifications
1 138 (21.13%) Degree
2 72 (11.03%) Computer Science Degree
3 32 (4.90%) Master's Degree
4 17 (2.60%) Security Cleared
5 16 (2.45%) AWS Certification
6 11 (1.68%) AWS Certified Solutions Architect
7 9 (1.38%) Azure Certification
8 8 (1.23%) DV Cleared
9 5 (0.77%) ISTQB
9 5 (0.77%) SC Cleared
10 2 (0.31%) CISSP
10 2 (0.31%) Microsoft Certification
10 2 (0.31%) Numerate Degree
11 1 (0.15%) (ISC)2 CCSP
11 1 (0.15%) CISA
11 1 (0.15%) Cisco Certification
11 1 (0.15%) CISM
11 1 (0.15%) CRISC
11 1 (0.15%) ISTQB Foundation Certification
11 1 (0.15%) TOGAF Certification
Quality Assurance & Compliance
1 50 (7.66%) Accessibility
2 44 (6.74%) Data Quality
3 41 (6.28%) QA
4 29 (4.44%) GDPR
5 18 (2.76%) PCI DSS
6 11 (1.68%) California Consumer Privacy Act
7 7 (1.07%) Basel II
7 7 (1.07%) Basel III
7 7 (1.07%) Dodd-Frank
7 7 (1.07%) IFRS
7 7 (1.07%) IFRS 9
8 6 (0.92%) HIPAA
9 4 (0.61%) GMP
9 4 (0.61%) NIST
10 3 (0.46%) WCAG
11 2 (0.31%) ISO/IEC 27001
12 1 (0.15%) COBIT
System Software
1 256 (39.20%) Docker
2 15 (2.30%) HDFS
3 7 (1.07%) Apache Flume
4 6 (0.92%) Active Directory
5 2 (0.31%) Hyper-V
5 2 (0.31%) KVM
5 2 (0.31%) NFS
5 2 (0.31%) SRDF
5 2 (0.31%) Veritas Cluster Server
5 2 (0.31%) VMware Infrastructure
5 2 (0.31%) Xen
Systems Management
1 239 (36.60%) Kubernetes
2 116 (17.76%) Terraform
3 27 (4.13%) Ansible
4 13 (1.99%) Prometheus
5 11 (1.68%) Grafana
6 8 (1.23%) Kibana
7 6 (0.92%) Argo
8 5 (0.77%) Oozie
8 5 (0.77%) Puppet
9 3 (0.46%) Istio
9 3 (0.46%) Progress Chef
10 1 (0.15%) HP Quality Center
10 1 (0.15%) Kubeflow
10 1 (0.15%) Microsoft Intune
10 1 (0.15%) Nagios
10 1 (0.15%) SCCM
Vendors
1 59 (9.04%) Google
2 55 (8.42%) Microsoft
3 38 (5.82%) Oracle
4 35 (5.36%) Databricks
5 24 (3.68%) IBM
6 17 (2.60%) Informatica
7 15 (2.30%) Red Hat
8 13 (1.99%) SAP
9 8 (1.23%) Cloudera
10 7 (1.07%) New Relic
11 6 (0.92%) F5
11 6 (0.92%) Solace
12 5 (0.77%) Atlassian
12 5 (0.77%) Intel
12 5 (0.77%) TIBCO
13 4 (0.61%) OpenAI
13 4 (0.61%) Talend
14 3 (0.46%) Cisco
14 3 (0.46%) ServiceNow
15 2 (0.31%) EMC