Identity Access Management Jobs

Identity and Access Management (IDAM)
UK

The following table provides summary statistics for permanent job vacancies with a requirement for Identity Access Management skills. Included is a benchmarking guide to the salaries offered in vacancies that have cited Identity Access Management over the 6 months to 7 December 2023 with a comparison to the same period in the previous 2 years.

6 months to
7 Dec 2023
Same period 2022 Same period 2021
Rank 319 456 594
Rank change year-on-year +137 +138 -297
Permanent jobs citing Identity Access Management 516 841 563
As % of all permanent jobs advertised in the UK 0.97% 0.68% 0.44%
As % of the Processes & Methodologies category 1.03% 0.72% 0.46%
Number of salaries quoted 258 538 417
10th Percentile £45,438 £50,720 £47,500
25th Percentile £57,813 £61,180 £57,500
Median annual salary (50th Percentile) £73,500 £75,000 £70,000
Median % change year-on-year -2.00% +7.14% +7.69%
75th Percentile £93,750 £92,500 £88,750
90th Percentile £98,750 £105,000 £99,250
UK excluding London median annual salary £70,000 £67,500 £65,000
% change year-on-year +3.70% +3.85% +30.00%

All Process and Methodology Skills
UK

Identity Access Management is in the Processes and Methodologies category. The following table is for comparison with the above and provides summary statistics for all permanent job vacancies with a requirement for process or methodology skills.

Permanent vacancies with a requirement for process or methodology skills 49,863 117,613 122,319
As % of all permanent jobs advertised in the UK 94.11% 95.75% 95.45%
Number of salaries quoted 36,022 72,003 82,155
10th Percentile £32,500 £34,700 £32,500
25th Percentile £43,750 £45,000 £42,500
Median annual salary (50th Percentile) £60,000 £61,000 £60,000
Median % change year-on-year -1.64% +1.67% +9.09%
75th Percentile £80,000 £82,500 £77,500
90th Percentile £99,680 £100,000 £95,000
UK excluding London median annual salary £52,500 £53,500 £50,000
% change year-on-year -1.87% +7.00% +4.17%

Identity Access Management
Job Vacancy Trend

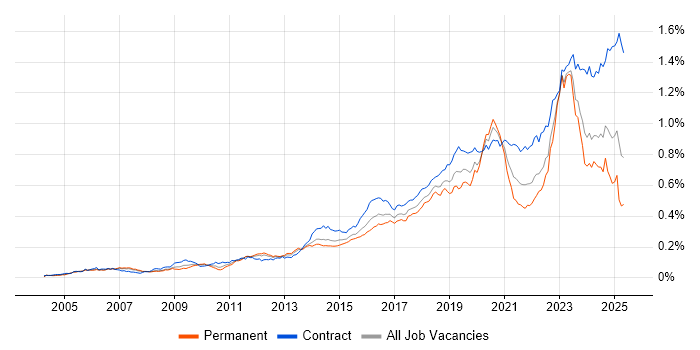
Job postings citing Identity Access Management as a proportion of all IT jobs advertised.

Job vacancy trend for Identity Access Management in the UK

Identity Access Management
Salary Trend

3-month moving average salary quoted in jobs citing Identity Access Management.

Salary trend for Identity Access Management in the UK

Identity Access Management
Salary Histogram

Salary distribution for jobs citing Identity Access Management over the 6 months to 7 December 2023.

Salary histogram for Identity Access Management in the UK

Identity Access Management
Top 16 Job Locations

The table below looks at the demand and provides a guide to the median salaries quoted in IT jobs citing Identity Access Management within the UK over the 6 months to 7 December 2023. The 'Rank Change' column provides an indication of the change in demand within each location based on the same 6 month period last year.

Location Rank Change
on Same Period
Last Year
Matching
Permanent
IT Job Ads
Median Salary
Past 6 Months
Median Salary
% Change
on Same Period
Last Year
Live
Jobs
England +130 444 £72,500 -3.33% 135
UK excluding London +210 316 £70,000 +3.70% 69
London +101 178 £87,500 +2.94% 78
Work from Home +51 128 £85,000 +13.33% 58
Midlands +150 74 £62,500 -10.71% 7
North of England +173 70 £65,000 -16.13% 17
South East +96 65 £70,000 +12.00% 15
South West +68 43 £62,750 +20.86% 14
East Midlands +90 42 £68,000 +13.33% 1
North West +136 36 £65,524 +4.84% 6
Yorkshire +118 34 £55,750 -35.36% 8
Scotland +25 30 £62,500 -8.18% 8
West Midlands +108 29 £57,500 -17.86% 6
Wales +36 22 £71,649 - 2
East of England +107 12 £65,000 -7.14% 9
Northern Ireland - 4 £67,500 - 2

Identity Access Management
Co-occurring Skills and Capabilities by Category

The follow tables expand on the table above by listing co-occurrences grouped by category. The same employment type, locality and period is covered with up to 20 co-occurrences shown in each of the following categories:

Application Platforms
1 20 (3.88%) Confluence
2 14 (2.71%) SharePoint
3 8 (1.55%) Oracle SOA Suite
3 8 (1.55%) WebLogic
4 4 (0.78%) SharePoint Server
5 2 (0.39%) NServiceBus
6 1 (0.19%) Apache
6 1 (0.19%) JBoss
6 1 (0.19%) nginx
6 1 (0.19%) Skype for Business
6 1 (0.19%) Tomcat
Applications
1 9 (1.74%) Microsoft Office
2 4 (0.78%) Trello
3 1 (0.19%) Microsoft Excel
Business Applications
1 4 (0.78%) Oracle Applications
1 4 (0.78%) Oracle ERP
2 1 (0.19%) Payment Gateway
Cloud Services
1 172 (33.33%) Azure
2 98 (18.99%) AWS
3 56 (10.85%) PaaS
3 56 (10.85%) SaaS
4 52 (10.08%) IaaS
5 50 (9.69%) Entra ID
6 43 (8.33%) Microsoft 365
7 33 (6.40%) GCP
8 27 (5.23%) Azure DevOps
9 26 (5.04%) Serverless
10 15 (2.91%) Azure AKS
11 12 (2.33%) AWS Lambda
12 11 (2.13%) Apigee
12 11 (2.13%) Azure ExpressRoute
12 11 (2.13%) Azure Functions
12 11 (2.13%) Azure Monitor
13 10 (1.94%) Azure Logic Apps
13 10 (1.94%) Cloud Computing
14 9 (1.74%) AWS CloudFormation
14 9 (1.74%) GitHub
Communications & Networking
1 55 (10.66%) Firewall
2 31 (6.01%) Network Security
3 16 (3.10%) VPN
4 14 (2.71%) TCP/IP
5 13 (2.52%) DNS
6 12 (2.33%) WAN
7 10 (1.94%) Kerberos
8 9 (1.74%) Intrusion Detection
8 9 (1.74%) LAN
9 7 (1.36%) Wi-Fi
10 6 (1.16%) HTTP
11 5 (0.97%) HTTPS
12 4 (0.78%) Internet
12 4 (0.78%) SD-WAN
12 4 (0.78%) VLAN
13 3 (0.58%) Wireshark
14 2 (0.39%) BGP
14 2 (0.39%) Cisco ASA
15 1 (0.19%) MPLS
15 1 (0.19%) SSL
Database & Business Intelligence
1 20 (3.88%) Azure SQL Database
2 16 (3.10%) SQL Server
3 12 (2.33%) Oracle Reports
4 9 (1.74%) Data Warehouse
4 9 (1.74%) MySQL
5 8 (1.55%) Oracle ODI
6 7 (1.36%) Amazon RDS
7 6 (1.16%) BigQuery
7 6 (1.16%) MongoDB
8 4 (0.78%) Metadata
8 4 (0.78%) NoSQL
9 3 (0.58%) PostgreSQL
9 3 (0.58%) Redis
9 3 (0.58%) Relational Database
10 2 (0.39%) Couchbase
10 2 (0.39%) DynamoDB
10 2 (0.39%) RDBMS
10 2 (0.39%) SQL Server Integration Services
11 1 (0.19%) Amazon Redshift
11 1 (0.19%) MariaDB
Development Applications
1 31 (6.01%) Git
1 31 (6.01%) Jenkins
2 27 (5.23%) JIRA
3 18 (3.49%) Sonatype Nexus
4 8 (1.55%) Oracle Forms
5 7 (1.36%) Bitbucket
6 6 (1.16%) JUnit
6 6 (1.16%) Spinnaker
7 5 (0.97%) Gatling
7 5 (0.97%) LoadRunner
8 4 (0.78%) SonarQube
8 4 (0.78%) Subversion
8 4 (0.78%) WebDriver
9 3 (0.58%) Team Foundation Server
10 2 (0.39%) Cucumber
10 2 (0.39%) REST Assured
11 1 (0.19%) DbUnit
11 1 (0.19%) Mockito
11 1 (0.19%) TeamCity
11 1 (0.19%) Visual Studio Code
General
1 293 (56.78%) Finance
2 253 (49.03%) Social Skills
3 216 (41.86%) Banking
4 179 (34.69%) Games
5 27 (5.23%) Inclusion and Diversity
6 15 (2.91%) Telecoms
7 14 (2.71%) Analytical Skills
8 10 (1.94%) Public Sector
9 8 (1.55%) Legal
10 7 (1.36%) Front Office
11 5 (0.97%) Law
11 5 (0.97%) Presentation Skills
11 5 (0.97%) Publishing
12 4 (0.78%) Advertising
12 4 (0.78%) Retail
13 2 (0.39%) Aviation
13 2 (0.39%) Back Office
13 2 (0.39%) Marketing
14 1 (0.19%) Influencing Skills
14 1 (0.19%) Organisational Skills
Job Titles
1 253 (49.03%) Architect
2 201 (38.95%) Security Architect
3 52 (10.08%) Senior
4 42 (8.14%) Security Engineer
5 32 (6.20%) Analyst
6 31 (6.01%) Consultant
6 31 (6.01%) Lead
7 29 (5.62%) Solutions Architect
8 28 (5.43%) Administrator
8 28 (5.43%) Security Consultant
9 24 (4.65%) Cloud Engineer
10 20 (3.88%) IAM Consultant
10 20 (3.88%) Security Administrator
11 19 (3.68%) Platform Engineer
12 18 (3.49%) Cloud Architect
12 18 (3.49%) DevOps Engineer
13 17 (3.29%) Azure Engineer
14 16 (3.10%) Cloud Platform Engineer
15 15 (2.91%) Infrastructure Engineer
16 13 (2.52%) Senior Analyst
Libraries, Frameworks & Software Standards
1 29 (5.62%) SailPoint
2 25 (4.84%) SAML
3 21 (4.07%) OAuth
3 21 (4.07%) REST
4 20 (3.88%) .NET
5 15 (2.91%) RESTful
6 14 (2.71%) ARM Templates
6 14 (2.71%) OpenID
7 11 (2.13%) JSON
7 11 (2.13%) LDAP
8 8 (1.55%) .NET Framework
8 8 (1.55%) Middleware
8 8 (1.55%) Oracle Fusion
9 6 (1.16%) ASP.NET
9 6 (1.16%) Kafka
9 6 (1.16%) XML
10 5 (0.97%) HTML
10 5 (0.97%) JWT
10 5 (0.97%) SOAP
10 5 (0.97%) YAML
Miscellaneous
1 53 (10.27%) Management Information System
2 22 (4.26%) Public Cloud
3 20 (3.88%) PKI
4 19 (3.68%) Cloud Native
5 16 (3.10%) Data Centre
6 13 (2.52%) Onboarding
6 13 (2.52%) Product Ownership
6 13 (2.52%) Security Posture
7 11 (2.13%) Private Cloud
8 9 (1.74%) Distributed Applications
8 9 (1.74%) Legacy Systems
9 7 (1.36%) Security Operations Centre
10 6 (1.16%) Enterprise Software
10 6 (1.16%) Insider Threat
10 6 (1.16%) Self-Motivation
11 5 (0.97%) Algorithms
11 5 (0.97%) Cyber Threat
11 5 (0.97%) Distributed Systems
12 4 (0.78%) Operational Technology
12 4 (0.78%) Reinsurance
Operating Systems
1 43 (8.33%) Windows
2 26 (5.04%) Linux
3 14 (2.71%) Windows Server
4 9 (1.74%) Red Hat Enterprise Linux
5 8 (1.55%) Android
5 8 (1.55%) Apple iOS
5 8 (1.55%) Unix
6 5 (0.97%) Mac OS
7 2 (0.39%) Windows Server 2012
7 2 (0.39%) Windows Server 2016
8 1 (0.19%) Solaris
8 1 (0.19%) Windows 10
8 1 (0.19%) Windows Server 2019
Processes & Methodologies
1 274 (53.10%) Cybersecurity
2 228 (44.19%) SIEM
3 198 (38.37%) Vulnerability Management
4 197 (38.18%) Asset Management
5 196 (37.98%) RBAC
6 185 (35.85%) Containerisation
7 184 (35.66%) Actionable Insight
8 182 (35.27%) Network Segmentation
9 178 (34.50%) IT Asset Management
10 101 (19.57%) Agile
11 86 (16.67%) Information Security
12 78 (15.12%) Cloud Security
13 63 (12.21%) DevOps
14 62 (12.02%) CI/CD
15 47 (9.11%) Migration
16 45 (8.72%) Roadmaps
17 41 (7.95%) Security Operations
18 39 (7.56%) DevSecOps
19 36 (6.98%) Security Architecture
20 34 (6.59%) Data Loss Prevention
Programming Languages
1 59 (11.43%) Python
2 55 (10.66%) PowerShell
3 45 (8.72%) Java
4 38 (7.36%) SQL
5 31 (6.01%) Bash
6 26 (5.04%) JavaScript
7 21 (4.07%) Go
8 18 (3.49%) C#
9 14 (2.71%) Groovy
9 14 (2.71%) Scala
10 11 (2.13%) TypeScript
11 10 (1.94%) Ruby
11 10 (1.94%) Shell Script
12 7 (1.36%) Bicep
12 7 (1.36%) Korn
13 4 (0.78%) PL/SQL
14 3 (0.58%) Lua
14 3 (0.58%) Rust
15 2 (0.39%) Kotlin
16 1 (0.19%) Swift
Qualifications
1 200 (38.76%) Security Cleared
2 53 (10.27%) CISSP
3 32 (6.20%) Degree
4 14 (2.71%) Computer Science Degree
5 13 (2.52%) Cisco Certification
6 11 (2.13%) CISM
6 11 (2.13%) CompTIA Security+
6 11 (2.13%) GIAC
6 11 (2.13%) SC Cleared
7 10 (1.94%) GSEC
8 8 (1.55%) (ISC)2 CCSP
8 8 (1.55%) Azure Certification
8 8 (1.55%) CCSP
9 7 (1.36%) Master's Degree
10 6 (1.16%) CCNP
10 6 (1.16%) ISACA
11 5 (0.97%) AWS Certification
11 5 (0.97%) CEH
12 4 (0.78%) CCNA
12 4 (0.78%) Microsoft Certification
Quality Assurance & Compliance
1 36 (6.98%) NIST
2 34 (6.59%) ISO/IEC 27001
3 14 (2.71%) Cyber Essentials
4 12 (2.33%) GDPR
5 11 (2.13%) NCSC
6 9 (1.74%) SLA
7 8 (1.55%) GRC
8 6 (1.16%) PCI DSS
9 4 (0.78%) COBIT
9 4 (0.78%) SOC 2
10 3 (0.58%) Data Quality
10 3 (0.58%) QA
11 2 (0.39%) Cyber Essentials PLUS
12 1 (0.19%) Basel III
12 1 (0.19%) GLBA
12 1 (0.19%) NIST 800
12 1 (0.19%) Sarbanes-Oxley
12 1 (0.19%) SOC 1
System Software
1 188 (36.43%) Virtual Machines
2 56 (10.85%) Active Directory
3 23 (4.46%) Docker
4 8 (1.55%) VMware Infrastructure
5 7 (1.36%) Hyper-V
6 6 (1.16%) Virtual Desktop
7 3 (0.58%) Virtual Servers
8 2 (0.39%) IAG
8 2 (0.39%) Terminal Services
8 2 (0.39%) VMware ESXi
9 1 (0.19%) Forefront TMG
9 1 (0.19%) Squid
9 1 (0.19%) VMware Workstation
9 1 (0.19%) vSphere
9 1 (0.19%) XenApp
Systems Management
1 45 (8.72%) Terraform
2 44 (8.53%) Kubernetes
3 33 (6.40%) Single Sign-On
4 31 (6.01%) Ansible
5 12 (2.33%) Microsoft Intune
6 9 (1.74%) Active Directory Federation Services
6 9 (1.74%) Istio
7 7 (1.36%) Progress Chef
8 6 (1.16%) Puppet
9 4 (0.78%) Demisto
9 4 (0.78%) Jamf Pro
9 4 (0.78%) Packer
10 3 (0.58%) Nagios
10 3 (0.58%) Nmap
10 3 (0.58%) PingFederate
10 3 (0.58%) Salt
10 3 (0.58%) SCCM
11 2 (0.39%) Norton AntiVirus
12 1 (0.19%) MOM
12 1 (0.19%) SCOM
Vendors
1 113 (21.90%) Microsoft
2 29 (5.62%) Okta
3 27 (5.23%) Oracle
3 27 (5.23%) Splunk
4 25 (4.84%) CyberArk
4 25 (4.84%) Google
5 22 (4.26%) ServiceNow
6 15 (2.91%) Palo Alto
7 13 (2.52%) Qualys
8 12 (2.33%) Cisco
9 11 (2.13%) Atlassian
9 11 (2.13%) CheckPoint
9 11 (2.13%) McAfee
9 11 (2.13%) VMware
10 9 (1.74%) Red Hat
11 8 (1.55%) ArcSight
11 8 (1.55%) Carbon Black
11 8 (1.55%) CrowdStrike
11 8 (1.55%) Hyperion
12 5 (0.97%) Centrify