Apache Tomcat
UK

The following table provides summary statistics for permanent job vacancies with a requirement for Tomcat skills. Included is a benchmarking guide to the salaries offered in vacancies that have cited Tomcat over the 6 months to 7 December 2023 with a comparison to the same period in the previous 2 years.

6 months to
7 Dec 2023
Same period 2022 Same period 2021
Rank 645 763 681
Rank change year-on-year +118 -82 -150
Permanent jobs citing Tomcat 85 315 432
As % of all permanent jobs advertised in the UK 0.16% 0.26% 0.34%
As % of the Application Platforms category 1.64% 2.18% 2.70%
Number of salaries quoted 76 220 308
10th Percentile £48,000 £37,750 £37,500
25th Percentile £52,250 £50,000 £50,000
Median annual salary (50th Percentile) £70,000 £62,500 £60,000
Median % change year-on-year +12.00% +4.17% -7.69%
75th Percentile £75,000 £75,813 £75,313
90th Percentile £77,542 £89,852 £87,500
UK excluding London median annual salary £70,000 £55,000 £55,250
% change year-on-year +27.27% -0.45% +0.45%

All Application Platform Skills
UK

Tomcat is in the Application Platforms category. The following table is for comparison with the above and provides summary statistics for all permanent job vacancies with a requirement for application platform skills.

Permanent vacancies with a requirement for application platform skills 5,189 14,436 16,006
As % of all permanent jobs advertised in the UK 9.79% 11.75% 12.49%
Number of salaries quoted 3,931 8,523 10,326
10th Percentile £31,500 £31,250 £30,000
25th Percentile £40,500 £41,250 £37,883
Median annual salary (50th Percentile) £55,000 £57,500 £55,000
Median % change year-on-year -4.35% +4.55% +4.76%
75th Percentile £77,500 £78,875 £72,500
90th Percentile £95,000 £97,290 £90,000
UK excluding London median annual salary £49,565 £50,000 £45,369
% change year-on-year -0.87% +10.21% +0.82%

Tomcat
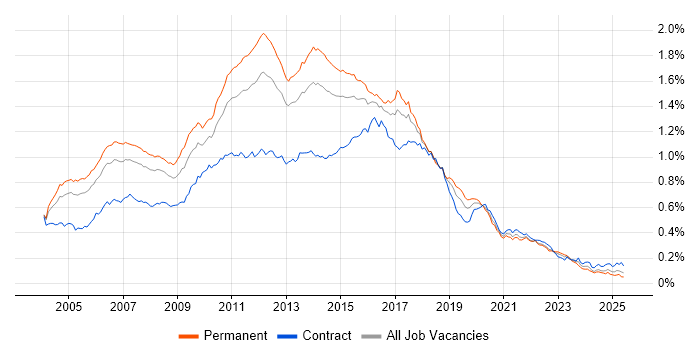
Job Vacancy Trend

Job postings citing Tomcat as a proportion of all IT jobs advertised.

Job vacancy trend for Tomcat in the UK

Tomcat
Salary Trend

3-month moving average salary quoted in jobs citing Tomcat.

Salary trend for Tomcat in the UK

Tomcat
Salary Histogram

Salary distribution for jobs citing Tomcat over the 6 months to 7 December 2023.

Salary histogram for Tomcat in the UK

Tomcat
Top 16 Job Locations

The table below looks at the demand and provides a guide to the median salaries quoted in IT jobs citing Tomcat within the UK over the 6 months to 7 December 2023. The 'Rank Change' column provides an indication of the change in demand within each location based on the same 6 month period last year.

Location Rank Change
on Same Period
Last Year
Matching
Permanent
IT Job Ads
Median Salary
Past 6 Months
Median Salary
% Change
on Same Period
Last Year
Live
Jobs
England +136 68 £70,000 +12.00% 38
UK excluding London +158 61 £70,000 +27.27% 24
Work from Home +120 49 £70,576 +4.56% 28
London +140 23 £70,000 +7.69% 24
South East +108 22 £55,000 -15.38% 13
North of England +147 15 £70,576 +42.39% 5
Wales +13 8 £70,576 +48.58%
Yorkshire +107 7 £70,576 -8.93% 2
Scotland +42 7 £75,000 +36.36% 2
North West +123 6 £65,351 -1.36% 2
South West +80 5 £72,777 -19.14% 1
West Midlands +113 2 £56,000 +17.89% 2
Midlands +108 2 £56,000 +17.89% 2
North East +39 2 £55,000 +17.02% 1
Northern Ireland +20 2 £70,000 +27.27%
East of England +106 1 £65,000 +18.18% 1

Tomcat
Co-occurring Skills and Capabilities by Category

The follow tables expand on the table above by listing co-occurrences grouped by category. The same employment type, locality and period is covered with up to 20 co-occurrences shown in each of the following categories:

Application Platforms
1 15 (17.65%) Confluence
2 14 (16.47%) Jetty
3 13 (15.29%) Apache
4 10 (11.76%) nginx
5 8 (9.41%) IIS
6 6 (7.06%) JBoss
6 6 (7.06%) SharePoint
7 4 (4.71%) Camunda
7 4 (4.71%) WebLogic
7 4 (4.71%) WebSphere
8 2 (2.35%) Apache Spark
9 1 (1.18%) Oracle SOA Suite
Business Applications
1 6 (7.06%) BusinessWorks
1 6 (7.06%) Dynamics CRM
2 1 (1.18%) Oracle Applications
2 1 (1.18%) Oracle EBS
Cloud Services
1 27 (31.76%) Azure
2 25 (29.41%) AWS
3 15 (17.65%) Power Platform
4 14 (16.47%) GCP
5 12 (14.12%) GitHub
6 11 (12.94%) AWS Lambda
6 11 (12.94%) Serverless
7 8 (9.41%) Amazon SQS
8 4 (4.71%) Amazon EC2
9 3 (3.53%) Amazon EKS
9 3 (3.53%) Amazon S3
9 3 (3.53%) Apigee
9 3 (3.53%) AWS CloudFormation
9 3 (3.53%) CloudFront
9 3 (3.53%) Route 53
10 2 (2.35%) OpenShift
10 2 (2.35%) SaaS
11 1 (1.18%) Azure DevOps
11 1 (1.18%) Cloud Run
11 1 (1.18%) Snowflake
Communications & Networking
1 19 (22.35%) Internet
2 13 (15.29%) DNS
2 13 (15.29%) SSL
2 13 (15.29%) TCP/IP
3 4 (4.71%) Firewall
Database & Business Intelligence
1 23 (27.06%) MySQL
2 22 (25.88%) SQL Server
3 15 (17.65%) Power BI
4 13 (15.29%) Big Data
4 13 (15.29%) Hadoop
5 11 (12.94%) DynamoDB
5 11 (12.94%) PostgreSQL
6 9 (10.59%) MongoDB
6 9 (10.59%) NoSQL
7 6 (7.06%) Oracle Database
7 6 (7.06%) SQL Server Integration Services
8 4 (4.71%) Relational Database
9 3 (3.53%) Oracle Reports
9 3 (3.53%) Redis
10 2 (2.35%) Apache Hive
10 2 (2.35%) Data Lake
10 2 (2.35%) Tableau
11 1 (1.18%) Amazon Redshift
11 1 (1.18%) Crystal Reports
11 1 (1.18%) Oracle BI EE
Development Applications
1 28 (32.94%) Git
2 23 (27.06%) Maven
3 17 (20.00%) Jenkins
4 15 (17.65%) JIRA
5 9 (10.59%) Gradle
6 6 (7.06%) Bitbucket
6 6 (7.06%) JUnit
6 6 (7.06%) Subversion
7 5 (5.88%) Artifactory
8 4 (4.71%) Cucumber
8 4 (4.71%) SonarQube
9 3 (3.53%) JSUnit
9 3 (3.53%) Mocha
9 3 (3.53%) Selenium
10 2 (2.35%) FindBugs
10 2 (2.35%) Log4j
10 2 (2.35%) Mercurial
10 2 (2.35%) Travis CI
11 1 (1.18%) Ant
11 1 (1.18%) Sonatype Nexus
General
1 35 (41.18%) Finance
2 32 (37.65%) Banking
3 22 (25.88%) Analytical Skills
4 12 (14.12%) Social Skills
5 11 (12.94%) Retail Banking
6 10 (11.76%) Retail
7 2 (2.35%) Presentation Skills
8 1 (1.18%) Public Sector
Job Titles
1 35 (41.18%) Developer
2 29 (34.12%) Java Developer
3 19 (22.35%) Senior
4 16 (18.82%) DevOps Engineer
5 14 (16.47%) Support Engineer
6 13 (15.29%) Senior Developer
6 13 (15.29%) Senior Java Developer
7 12 (14.12%) Architect
7 12 (14.12%) Solutions Architect
8 7 (8.24%) Administrator
8 7 (8.24%) Applications Support
8 7 (8.24%) Infrastructure Engineer
9 6 (7.06%) Applications Developer
9 6 (7.06%) Consultant
9 6 (7.06%) Senior Infrastructure Engineer
10 5 (5.88%) JIRA Engineer
10 5 (5.88%) Systems Administrator
10 5 (5.88%) Unix Administrator
10 5 (5.88%) Unix Systems Administrator
11 3 (3.53%) React Developer
Libraries, Frameworks & Software Standards
1 37 (43.53%) Spring
2 20 (23.53%) CSS
2 20 (23.53%) HTML
2 20 (23.53%) jQuery
3 19 (22.35%) Spring Boot
4 18 (21.18%) JSON
5 17 (20.00%) XML
6 14 (16.47%) SOAP
7 13 (15.29%) Node.js
7 13 (15.29%) REST
8 12 (14.12%) Kafka
8 12 (14.12%) Web Services
9 11 (12.94%) J2EE
9 11 (12.94%) React
10 10 (11.76%) RabbitMQ
10 10 (11.76%) RESTful
11 8 (9.41%) .NET
12 7 (8.24%) Middleware
13 6 (7.06%) ASP.NET
13 6 (7.06%) ASP.NET MVC
Miscellaneous
1 24 (28.24%) Public Cloud
2 11 (12.94%) Online Banking
3 7 (8.24%) Enterprise Software
4 4 (4.71%) Legacy Systems
5 2 (2.35%) Algorithms
5 2 (2.35%) Data Structures
5 2 (2.35%) Distributed Systems
5 2 (2.35%) Greenfield Project
5 2 (2.35%) Onboarding
6 1 (1.18%) AS400
6 1 (1.18%) Clustering
6 1 (1.18%) Self-Motivation
Operating Systems
1 35 (41.18%) Linux
2 24 (28.24%) Unix
3 6 (7.06%) Windows
4 4 (4.71%) CentOS
4 4 (4.71%) Ubuntu
4 4 (4.71%) Windows 10
4 4 (4.71%) Windows Server 2019
5 1 (1.18%) Red Hat Enterprise Linux
5 1 (1.18%) Windows Server
5 1 (1.18%) Windows Server 2008
5 1 (1.18%) Windows Server 2012
Processes & Methodologies
1 45 (52.94%) Agile
2 33 (38.82%) DevOps
3 30 (35.29%) Microservices
4 22 (25.88%) Scrum
5 17 (20.00%) Mentoring
6 16 (18.82%) Open Source
7 15 (17.65%) Computer Science
8 13 (15.29%) Systems Thinking
9 12 (14.12%) Technical Leadership
10 11 (12.94%) Customer Experience
10 11 (12.94%) Full Stack Development
10 11 (12.94%) ITIL
10 11 (12.94%) Software Architecture
11 10 (11.76%) OOP
11 10 (11.76%) Problem-Solving
11 10 (11.76%) Software Engineering
12 9 (10.59%) Data Strategy
12 9 (10.59%) MVC
13 8 (9.41%) Data Analysis
13 8 (9.41%) Visualisation
Programming Languages
1 58 (68.24%) Java
2 39 (45.88%) SQL
3 34 (40.00%) JavaScript
4 18 (21.18%) Python
5 9 (10.59%) PL/SQL
6 7 (8.24%) C#
7 6 (7.06%) Bash
7 6 (7.06%) PowerShell
7 6 (7.06%) Shell Script
7 6 (7.06%) T-SQL
8 5 (5.88%) PHP
9 4 (4.71%) Perl
10 3 (3.53%) TypeScript
11 1 (1.18%) Go
Qualifications
1 18 (21.18%) Degree
2 7 (8.24%) Computer Science Degree
3 6 (7.06%) ITIL Foundation Certificate
4 3 (3.53%) SC Cleared
4 3 (3.53%) Security Cleared
5 2 (2.35%) DV Cleared
5 2 (2.35%) OCP
5 2 (2.35%) Oracle Certification
6 1 (1.18%) Master's Degree
Quality Assurance & Compliance
1 2 (2.35%) Data Quality
1 2 (2.35%) QA
2 1 (1.18%) NIST
2 1 (1.18%) SLA
System Software
1 17 (20.00%) Docker
2 5 (5.88%) VMware Infrastructure
3 1 (1.18%) vSphere
Systems Management
1 14 (16.47%) Ansible
2 10 (11.76%) Kubernetes
3 7 (8.24%) Terraform
4 5 (5.88%) Progress Chef
5 4 (4.71%) Cobbler
5 4 (4.71%) ZABBIX
6 2 (2.35%) Puppet
7 1 (1.18%) SCCM
Vendors
1 15 (17.65%) Oracle
2 14 (16.47%) Atlassian
3 7 (8.24%) Microsoft
3 7 (8.24%) TIBCO
4 6 (7.06%) VMware
5 5 (5.88%) Red Hat
6 3 (3.53%) Databricks
7 2 (2.35%) Ab Initio
8 1 (1.18%) BEA
8 1 (1.18%) IBM
8 1 (1.18%) MuleSoft