Unified Modeling Language (UML)
UK

The following table provides summary statistics for permanent job vacancies with a requirement for UML skills. Included is a benchmarking guide to the salaries offered in vacancies that have cited UML over the 6 months to 28 November 2023 with a comparison to the same period in the previous 2 years.

6 months to
28 Nov 2023
Same period 2022 Same period 2021
Rank 397 415 466
Rank change year-on-year +18 +51 -43
Permanent jobs citing UML 378 983 845
As % of all permanent jobs advertised in the UK 0.70% 0.78% 0.66%
As % of the Processes & Methodologies category 0.74% 0.82% 0.69%
Number of salaries quoted 296 630 489
10th Percentile £41,000 £36,953 £40,500
25th Percentile £55,000 £46,250 £46,250
Median annual salary (50th Percentile) £67,500 £62,500 £62,500
Median % change year-on-year +8.00% - +4.17%
75th Percentile £92,500 £80,000 £85,000
90th Percentile £106,250 £101,375 £101,250
UK excluding London median annual salary £62,500 £55,000 £55,000
% change year-on-year +13.64% - -

All Process and Methodology Skills
UK

UML is in the Processes and Methodologies category. The following table is for comparison with the above and provides summary statistics for all permanent job vacancies with a requirement for process or methodology skills.

Permanent vacancies with a requirement for process or methodology skills 51,121 120,104 122,523
As % of all permanent jobs advertised in the UK 94.09% 95.72% 95.43%
Number of salaries quoted 36,956 73,203 81,032
10th Percentile £32,500 £34,313 £32,500
25th Percentile £43,750 £45,000 £42,500
Median annual salary (50th Percentile) £60,000 £60,000 £59,000
Median % change year-on-year - +1.69% +7.27%
75th Percentile £80,000 £81,250 £77,500
90th Percentile £98,750 £100,000 £95,000
UK excluding London median annual salary £52,500 £53,000 £50,000
% change year-on-year -0.94% +6.00% +4.17%

UML
Job Vacancy Trend

Job postings citing UML as a proportion of all IT jobs advertised.
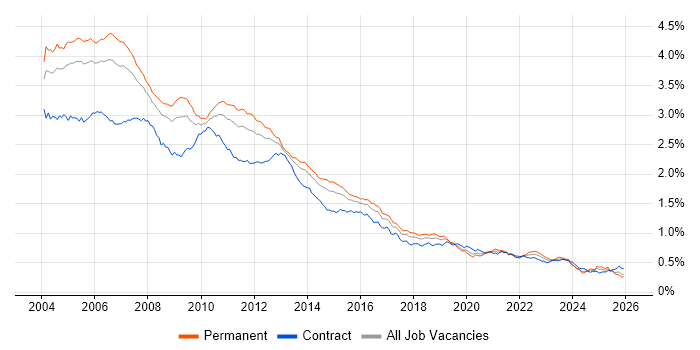
Job vacancy trend for UML in the UK

UML
Salary Trend

3-month moving average salary quoted in jobs citing UML.

Salary trend for UML in the UK

UML
Salary Histogram

Salary distribution for jobs citing UML over the 6 months to 28 November 2023.

Salary histogram for UML in the UK

UML
Top 16 Job Locations

The table below looks at the demand and provides a guide to the median salaries quoted in IT jobs citing UML within the UK over the 6 months to 28 November 2023. The 'Rank Change' column provides an indication of the change in demand within each location based on the same 6 month period last year.

Location Rank Change
on Same Period
Last Year
Matching
Permanent
IT Job Ads
Median Salary
Past 6 Months
Median Salary
% Change
on Same Period
Last Year
Live
Jobs
England +18 345 £67,500 +12.50% 132
UK excluding London -22 224 £62,500 +13.64% 106
Work from Home +35 154 £65,351 +4.56% 58
London +141 140 £77,500 -3.13% 42
South West +30 82 £65,351 +53.77% 35
North of England +104 54 £66,000 +25.71% 16
North West +130 40 £72,500 +34.88% 12
Midlands +57 35 £55,000 - 9
South East -11 30 £65,000 +7.44% 36
East Midlands +28 19 £37,500 -31.82% 5
West Midlands +67 16 £55,000 -12.00% 4
Yorkshire +52 13 £65,351 +24.48% 3
Scotland +43 11 £65,351 +4.56% 5
Wales -14 5 £56,500 +21.57%
Northern Ireland - 4 - - 2
East of England +69 3 - - 11

UML
Co-occurring Skills and Capabilities by Category

The follow tables expand on the table above by listing co-occurrences grouped by category. The same employment type, locality and period is covered with up to 20 co-occurrences shown in each of the following categories:

Application Platforms
1 26 (6.88%) Confluence
2 9 (2.38%) SharePoint
3 6 (1.59%) CMS
4 4 (1.06%) Adobe Experience Manager
4 4 (1.06%) Drupal
5 3 (0.79%) Cloud Foundry
6 2 (0.53%) Appian
6 2 (0.53%) Oracle SOA Suite
6 2 (0.53%) Oracle Workflow
7 1 (0.26%) ArcGIS
Applications
1 14 (3.70%) Microsoft Office
2 7 (1.85%) MS Visio
3 6 (1.59%) OrCAD
4 5 (1.32%) Microsoft Excel
4 5 (1.32%) Microsoft PowerPoint
5 3 (0.79%) Microsoft Project
5 3 (0.79%) Simulink
Business Applications
1 14 (3.70%) Sparx Enterprise Architect
2 4 (1.06%) Dynamics CRM
3 3 (0.79%) SAP S/4HANA
4 2 (0.53%) Magento
4 2 (0.53%) SAP Hybris
4 2 (0.53%) Workday HCM
5 1 (0.26%) Summit
Cloud Services
1 118 (31.22%) Azure
2 29 (7.67%) Serverless
3 28 (7.41%) Azure DevOps
4 22 (5.82%) AWS
5 15 (3.97%) Microsoft 365
6 13 (3.44%) PaaS
7 12 (3.17%) GitHub
7 12 (3.17%) IaaS
7 12 (3.17%) Power Platform
8 11 (2.91%) SaaS
9 8 (2.12%) Azure API Management
9 8 (2.12%) Azure Cosmos DB
10 7 (1.85%) Dynamics 365
11 6 (1.59%) Azure Monitor
11 6 (1.59%) Azure Sentinel
11 6 (1.59%) Azure Service Bus
11 6 (1.59%) Cloudflare
12 3 (0.79%) Amazon EC2
13 2 (0.53%) SAP Commerce Cloud
13 2 (0.53%) SuccessFactors
Communications & Networking
1 12 (3.17%) Software-Defined Radio
2 6 (1.59%) Ethernet
2 6 (1.59%) Network Security
3 4 (1.06%) SAN
4 3 (0.79%) SpaceWire
5 2 (0.53%) HTTP
5 2 (0.53%) Internet
6 1 (0.26%) IPsec
6 1 (0.26%) Kerberos
6 1 (0.26%) SSL
6 1 (0.26%) Tactical Data Link
6 1 (0.26%) VLAN
Database & Business Intelligence
1 58 (15.34%) SQL Server
2 11 (2.91%) Power BI
3 7 (1.85%) Oracle Database
4 6 (1.59%) Redis
5 4 (1.06%) GIS
5 4 (1.06%) Relational Database
6 3 (0.79%) Big Data
6 3 (0.79%) Metadata
6 3 (0.79%) MongoDB
6 3 (0.79%) NoSQL
7 1 (0.26%) Amazon RDS
7 1 (0.26%) Data Lake
7 1 (0.26%) Data Warehouse
7 1 (0.26%) Geospatial Data
7 1 (0.26%) PostgreSQL
Development Applications
1 65 (17.20%) JIRA
2 28 (7.41%) Git
3 25 (6.61%) Visual Studio
4 21 (5.56%) Bitbucket
5 17 (4.50%) Rational DOORS
6 15 (3.97%) Jenkins
7 7 (1.85%) Team Foundation Server
8 5 (1.32%) Atlassian Bamboo
8 5 (1.32%) MSTest
8 5 (1.32%) NUnit
8 5 (1.32%) Rational Rhapsody
9 4 (1.06%) CppUnit
9 4 (1.06%) JUnit
10 3 (0.79%) CMake
11 2 (0.53%) GoogleTest
11 2 (0.53%) Hudson
11 2 (0.53%) Robot Framework
11 2 (0.53%) Sonatype Nexus
11 2 (0.53%) Subversion
11 2 (0.53%) VectorCAST
General
1 119 (31.48%) Social Skills
2 108 (28.57%) Finance
3 32 (8.47%) Military
3 32 (8.47%) Public Sector
4 27 (7.14%) Publishing
5 21 (5.56%) Banking
5 21 (5.56%) Retail
6 18 (4.76%) Automotive
6 18 (4.76%) Presentation Skills
7 14 (3.70%) Games
7 14 (3.70%) Influencing Skills
8 13 (3.44%) Analytical Skills
9 11 (2.91%) Aerospace
10 10 (2.65%) Electronics
11 9 (2.38%) Marketing
12 8 (2.12%) Telecoms
13 7 (1.85%) Law
13 7 (1.85%) Manufacturing
14 6 (1.59%) Documentation Skills
14 6 (1.59%) Retail Banking
Job Titles
1 188 (49.74%) Architect
2 137 (36.24%) Solutions Architect
3 61 (16.14%) Analyst
4 54 (14.29%) Business Analyst
5 41 (10.85%) Senior
6 35 (9.26%) Technical Architect
7 31 (8.20%) Developer
8 30 (7.94%) Software Engineer
9 26 (6.88%) Consultant
10 23 (6.08%) Systems Architect
11 22 (5.82%) Lead
12 17 (4.50%) Systems Engineer
13 15 (3.97%) Data Architect
14 14 (3.70%) 3D Developer
14 14 (3.70%) Games Developer
14 14 (3.70%) Senior Analyst
14 14 (3.70%) Unity 3D Developer
15 12 (3.17%) Embedded Engineer
15 12 (3.17%) Lead Systems Engineer
15 12 (3.17%) Senior Business Analyst
Libraries, Frameworks & Software Standards
1 57 (15.08%) REST
2 49 (12.96%) Spring
3 36 (9.52%) .NET
4 33 (8.73%) Hibernate
4 33 (8.73%) JDBC
4 33 (8.73%) Struts
5 26 (6.88%) React
5 26 (6.88%) SOAP
6 14 (3.70%) Unity (Game Engine)
7 13 (3.44%) .NET Framework
8 12 (3.17%) JSON
9 11 (2.91%) HTML
9 11 (2.91%) Node.js
9 11 (2.91%) Web Services
10 9 (2.38%) ASP.NET
11 8 (2.12%) .NET Core
11 8 (2.12%) XML
12 7 (1.85%) LINQ
12 7 (1.85%) RESTful
12 7 (1.85%) WinForms
Miscellaneous
1 47 (12.43%) Public Cloud
2 46 (12.17%) Enterprise Software
3 33 (8.73%) Product Ownership
4 19 (5.03%) Management Information System
5 18 (4.76%) Embedded Systems
6 15 (3.97%) Reinsurance
7 14 (3.70%) Legacy Systems
7 14 (3.70%) Self-Motivation
7 14 (3.70%) Virtual Reality
8 13 (3.44%) FMCG
9 12 (3.17%) Cloud Native
10 7 (1.85%) FPGA
10 7 (1.85%) PMI
10 7 (1.85%) VHDL
11 6 (1.59%) Distributed Architecture
12 5 (1.32%) Algorithms
12 5 (1.32%) Raspberry Pi
13 4 (1.06%) Device Driver
13 4 (1.06%) Distributed Systems
14 3 (0.79%) PCIe
Operating Systems
1 23 (6.08%) Linux
2 16 (4.23%) Windows
3 3 (0.79%) VxWorks
4 1 (0.26%) Unix
Processes & Methodologies
1 199 (52.65%) Agile
2 107 (28.31%) Software Engineering
3 104 (27.51%) TOGAF
4 102 (26.98%) DevOps
5 91 (24.07%) Microservices
6 89 (23.54%) Problem-Solving
7 87 (23.02%) Analytics
8 86 (22.75%) ArchiMate
9 79 (20.90%) Stakeholder Management
10 75 (19.84%) Data Modelling
11 73 (19.31%) Design Patterns
12 65 (17.20%) Technical Architecture
13 60 (15.87%) Project Delivery
14 58 (15.34%) Scrum
15 57 (15.08%) BPMN
16 56 (14.81%) Architectural Patterns
16 56 (14.81%) User Experience
17 55 (14.55%) Use Case
18 51 (13.49%) Business Case
19 50 (13.23%) Actionable Insight
Programming Languages
1 81 (21.43%) SQL
2 40 (10.58%) C#
3 38 (10.05%) Java
4 33 (8.73%) PL/SQL
5 31 (8.20%) C++
6 26 (6.88%) C
7 21 (5.56%) JavaScript
8 17 (4.50%) Python
9 11 (2.91%) MATLAB
10 9 (2.38%) Ada
10 9 (2.38%) Bash
11 8 (2.12%) PowerShell
12 7 (1.85%) Delphi
13 6 (1.59%) Embedded C
13 6 (1.59%) Kusto Query Language
14 5 (1.32%) TypeScript
15 3 (0.79%) Shell Script
16 2 (0.53%) ANSI C
17 1 (0.26%) Embedded C++
Qualifications
1 160 (42.33%) Security Cleared
2 119 (31.48%) Degree
3 114 (30.16%) SC Cleared
4 26 (6.88%) BPSS Clearance
5 22 (5.82%) TOGAF Certification
6 16 (4.23%) DV Cleared
7 14 (3.70%) Computer Science Degree
8 13 (3.44%) Azure Certification
8 13 (3.44%) Master's Degree
9 8 (2.12%) PMI Certification
10 6 (1.59%) ISTQB
11 4 (1.06%) IIBA
11 4 (1.06%) MBCS
12 2 (0.53%) Chartered Engineer
12 2 (0.53%) ISEB
13 1 (0.26%) APMP
13 1 (0.26%) CBAP
13 1 (0.26%) MCSA
13 1 (0.26%) Microsoft Certification
13 1 (0.26%) PMP
Quality Assurance & Compliance
1 16 (4.23%) ISO/IEC 15288
2 13 (3.44%) Data Quality
3 11 (2.91%) ISO/IEC 27001
4 8 (2.12%) Cyber Essentials
5 7 (1.85%) ISO 9001
6 6 (1.59%) DICOM
6 6 (1.59%) HL7
6 6 (1.59%) ISO 9000
6 6 (1.59%) PCI DSS
6 6 (1.59%) QA
7 5 (1.32%) MISRA
7 5 (1.32%) NCSC
8 4 (1.06%) Accessibility
8 4 (1.06%) NIST
9 3 (0.79%) IEC 61508
9 3 (0.79%) ISO 26262
10 2 (0.53%) Def Stans
10 2 (0.53%) GAMP
10 2 (0.53%) MISRA C
11 1 (0.26%) TickIT
System Software
1 11 (2.91%) Docker
1 11 (2.91%) Firmware
2 4 (1.06%) Active Directory
3 2 (0.53%) Virtual Machines
4 1 (0.26%) RACF
Systems Management
1 11 (2.91%) Kubernetes
2 5 (1.32%) Terraform
3 1 (0.26%) Ansible
3 1 (0.26%) Single Sign-On
Vendors
1 73 (19.31%) Microsoft
2 14 (3.70%) Informatica
2 14 (3.70%) Sparx
3 10 (2.65%) SAP
4 9 (2.38%) Oracle
5 8 (2.12%) IBM
6 6 (1.59%) Adobe
6 6 (1.59%) Cadence
7 4 (1.06%) Citrix
8 3 (0.79%) Atlassian
8 3 (0.79%) Salesforce
9 2 (0.53%) ForgeRock
9 2 (0.53%) Marketo
9 2 (0.53%) Workday
10 1 (0.26%) ESRI
10 1 (0.26%) MuleSoft
10 1 (0.26%) Remedy
10 1 (0.26%) Sun