Sonatype Nexus
UK

The following table provides summary statistics for permanent job vacancies with a requirement for Sonatype Nexus skills. Included is a benchmarking guide to the salaries offered in vacancies that have cited Sonatype Nexus over the 6 months to 7 December 2023 with a comparison to the same period in the previous 2 years.

6 months to
7 Dec 2023
Same period 2022 Same period 2021
Rank 561 659 673
Rank change year-on-year +98 +14 -53
Permanent jobs citing Sonatype Nexus 170 447 442
As % of all permanent jobs advertised in the UK 0.32% 0.36% 0.34%
As % of the Development Applications category 2.46% 2.03% 1.69%
Number of salaries quoted 123 209 148
10th Percentile £55,250 £46,779 £47,500
25th Percentile £61,180 £57,500 £57,500
Median annual salary (50th Percentile) £80,000 £80,000 £70,000
Median % change year-on-year - +14.29% -0.71%
75th Percentile £94,237 £95,000 £87,500
90th Percentile £105,000 £103,750 £105,000
UK excluding London median annual salary £70,576 £65,000 £60,000
% change year-on-year +8.58% +8.33% +9.09%

All Development Application Skills
UK

Sonatype Nexus is in the Development Applications category. The following table is for comparison with the above and provides summary statistics for all permanent job vacancies with a requirement for development application skills.

Permanent vacancies with a requirement for development application skills 6,913 22,032 26,166
As % of all permanent jobs advertised in the UK 13.05% 17.94% 20.42%
Number of salaries quoted 5,287 12,597 16,374
10th Percentile £41,400 £40,000 £36,750
25th Percentile £50,000 £48,750 £45,000
Median annual salary (50th Percentile) £65,000 £65,000 £60,000
Median % change year-on-year - +8.33% +9.09%
75th Percentile £82,548 £82,500 £76,250
90th Percentile £100,000 £99,339 £91,250
UK excluding London median annual salary £58,000 £55,000 £50,000
% change year-on-year +5.45% +10.00% -

Sonatype Nexus
Job Vacancy Trend

Job postings citing Sonatype Nexus as a proportion of all IT jobs advertised.
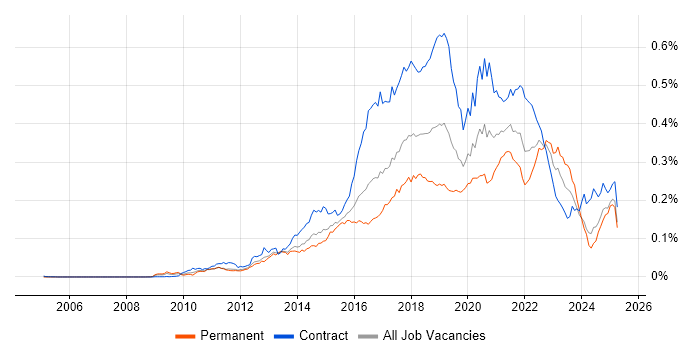
Job vacancy trend for Sonatype Nexus in the UK

Sonatype Nexus
Salary Trend

3-month moving average salary quoted in jobs citing Sonatype Nexus.

Salary trend for Sonatype Nexus in the UK

Sonatype Nexus
Salary Histogram

Salary distribution for jobs citing Sonatype Nexus over the 6 months to 7 December 2023.

Salary histogram for Sonatype Nexus in the UK

Sonatype Nexus
Top 15 Job Locations

The table below looks at the demand and provides a guide to the median salaries quoted in IT jobs citing Sonatype Nexus within the UK over the 6 months to 7 December 2023. The 'Rank Change' column provides an indication of the change in demand within each location based on the same 6 month period last year.

Location Rank Change
on Same Period
Last Year
Matching
Permanent
IT Job Ads
Median Salary
Past 6 Months
Median Salary
% Change
on Same Period
Last Year
Live
Jobs
England +80 127 £80,000 - 30
UK excluding London +199 115 £70,576 +8.58% 21
Work from Home +218 100 £83,038 +15.27% 26
London +73 52 £82,500 -8.33% 18
North of England +148 27 £83,577 +19.40% 3
South West +77 24 £69,447 -2.21% 4
Wales +36 22 - - 5
South East +129 20 £80,000 +3.23% 7
Scotland +35 20 £70,576 +17.63% 2
North West +111 14 £85,000 +21.43% 1
West Midlands +90 14 £85,000 +61.90%
Midlands +81 14 £85,000 +61.90%
Yorkshire +115 12 £83,577 +40.40% 2
East of England +125 9 £85,000 +6.25%
North East +46 8 £85,000 +6.25%

Sonatype Nexus
Co-occurring Skills and Capabilities by Category

The follow tables expand on the table above by listing co-occurrences grouped by category. The same employment type, locality and period is covered with up to 20 co-occurrences shown in each of the following categories:

Application Platforms
1 24 (14.12%) IIS
1 24 (14.12%) WebLogic
2 22 (12.94%) Confluence
3 7 (4.12%) OpenStack
4 1 (0.59%) nginx
4 1 (0.59%) SharePoint
4 1 (0.59%) Tomcat
Applications
1 2 (1.18%) Microsoft Excel
1 2 (1.18%) Microsoft Office
1 2 (1.18%) MS Visio
Cloud Services
1 74 (43.53%) Azure
2 44 (25.88%) GCP
3 43 (25.29%) AWS
4 30 (17.65%) Azure DevOps
5 25 (14.71%) GitHub
6 23 (13.53%) Serverless
7 15 (8.82%) Azure AKS
8 13 (7.65%) Azure Monitor
9 10 (5.88%) Azure Cosmos DB
10 9 (5.29%) Apigee
10 9 (5.29%) Cloud Composer
10 9 (5.29%) Google Kubernetes Engine
11 8 (4.71%) Amazon CloudWatch
11 8 (4.71%) Amazon S3
11 8 (4.71%) Entra ID
11 8 (4.71%) GitHub Actions
11 8 (4.71%) Virtual Private Cloud
12 7 (4.12%) Datadog
13 6 (3.53%) Azure API Management
13 6 (3.53%) Azure Pipelines
Communications & Networking
1 22 (12.94%) Cisco Nexus
1 22 (12.94%) DNS
2 21 (12.35%) Firewall
3 13 (7.65%) BGP
3 13 (7.65%) OSPF
4 11 (6.47%) WAN
5 9 (5.29%) LAN
5 9 (5.29%) MPLS
5 9 (5.29%) SD-WAN
6 8 (4.71%) Ethernet VPN
6 8 (4.71%) VXLAN
7 7 (4.12%) FabricPath
8 6 (3.53%) Internet
9 5 (2.94%) TCP/IP
10 4 (2.35%) DHCP
10 4 (2.35%) Network Security
10 4 (2.35%) VPN
10 4 (2.35%) Wireless
11 3 (1.76%) Cisco ASA
11 3 (1.76%) Wireshark
Database & Business Intelligence
1 27 (15.88%) SQL Server
2 24 (14.12%) Elasticsearch
3 9 (5.29%) BigQuery
4 7 (4.12%) Amazon Redshift
4 7 (4.12%) DynamoDB
5 6 (3.53%) NoSQL
6 4 (2.35%) Amazon RDS
7 3 (1.76%) Azure SQL Database
7 3 (1.76%) Hadoop
8 2 (1.18%) Data Warehouse
8 2 (1.18%) PostgreSQL
9 1 (0.59%) Sybase ASE
Development Applications
1 90 (52.94%) Jenkins
2 59 (34.71%) Git
2 59 (34.71%) GitLab
3 53 (31.18%) JIRA
4 44 (25.88%) Artifactory
5 43 (25.29%) SonarQube
6 36 (21.18%) Maven
7 24 (14.12%) Spinnaker
8 18 (10.59%) Bitbucket
8 18 (10.59%) Cucumber
9 12 (7.06%) JUnit
10 10 (5.88%) Cypress.io
10 10 (5.88%) Gradle
10 10 (5.88%) Zephyr
11 9 (5.29%) Selenium
11 9 (5.29%) TeamCity
12 8 (4.71%) Ant
12 8 (4.71%) Atlassian Bamboo
12 8 (4.71%) Mocha
13 6 (3.53%) Subversion
General
1 71 (41.76%) Finance
2 58 (34.12%) Banking
3 26 (15.29%) Analytical Skills
4 19 (11.18%) Social Skills
5 8 (4.71%) Influencing Skills
6 7 (4.12%) Retail
7 3 (1.76%) Public Sector
7 3 (1.76%) Retail Banking
8 2 (1.18%) Avionics
8 2 (1.18%) Documentation Skills
8 2 (1.18%) Financial Institution
9 1 (0.59%) Advertising
9 1 (0.59%) Inclusion and Diversity
9 1 (0.59%) Marketing
9 1 (0.59%) Pharmaceutical
9 1 (0.59%) Telecoms
Job Titles
1 59 (34.71%) DevOps Engineer
2 34 (20.00%) Senior
3 25 (14.71%) Analyst
4 24 (14.12%) Applications Support
4 24 (14.12%) Applications Support Analyst
4 24 (14.12%) Support Analyst
5 18 (10.59%) Senior DevOps
6 17 (10.00%) Software Engineer
7 15 (8.82%) Senior DevOps Engineer
8 14 (8.24%) Developer
8 14 (8.24%) Network Engineer
9 11 (6.47%) Azure DevOps Engineer
9 11 (6.47%) Azure Engineer
10 10 (5.88%) Lead
11 9 (5.29%) Architect
11 9 (5.29%) AWS Engineer
12 8 (4.71%) AWS DevOps
12 8 (4.71%) Cloud Engineer
12 8 (4.71%) Senior Developer
13 7 (4.12%) JIRA Engineer
Libraries, Frameworks & Software Standards
1 44 (25.88%) .NET
2 34 (20.00%) Spring
3 29 (17.06%) Spring Boot
4 24 (14.12%) J2EE
4 24 (14.12%) Java EE
4 24 (14.12%) Node.js
5 22 (12.94%) React
6 17 (10.00%) Express.js
7 13 (7.65%) JSON
7 13 (7.65%) YAML
8 12 (7.06%) Elastic Stack
9 11 (6.47%) Jest
10 10 (5.88%) AngularJS
10 10 (5.88%) RESTful
10 10 (5.88%) Web Services
11 9 (5.29%) ARM Templates
11 9 (5.29%) Hibernate
11 9 (5.29%) REST
12 8 (4.71%) .NET Core
12 8 (4.71%) HTML
Miscellaneous
1 28 (16.47%) Cloud Native
2 21 (12.35%) Legacy Systems
2 21 (12.35%) Virtual Team
3 19 (11.18%) Data Centre
4 17 (10.00%) Public Cloud
5 14 (8.24%) Distributed Applications
6 12 (7.06%) Product Ownership
7 10 (5.88%) PKI
8 8 (4.71%) Algorithms
8 8 (4.71%) Credit Risk
9 7 (4.12%) Legacy Applications
9 7 (4.12%) Self-Motivation
10 6 (3.53%) Private Cloud
11 4 (2.35%) Distributed Systems
11 4 (2.35%) Enterprise Software
12 3 (1.76%) Greenfield Project
12 3 (1.76%) Hedge funds
13 2 (1.18%) Management Information System
13 2 (1.18%) Onboarding
14 1 (0.59%) Security Posture
Operating Systems
1 40 (23.53%) Windows
2 35 (20.59%) Unix
3 30 (17.65%) Linux
4 24 (14.12%) Android
5 14 (8.24%) Windows Server
6 10 (5.88%) Windows Server 2019
7 3 (1.76%) Windows Server 2012
7 3 (1.76%) Windows Server 2016
8 1 (0.59%) Red Hat Enterprise Linux
Processes & Methodologies
1 101 (59.41%) DevOps
2 87 (51.18%) Agile
3 74 (43.53%) CI/CD
4 57 (33.53%) Containerisation
5 53 (31.18%) Problem-Solving
6 39 (22.94%) ITIL
7 35 (20.59%) Software Engineering
8 34 (20.00%) Analytics
8 34 (20.00%) Microservices
9 29 (17.06%) Mentoring
9 29 (17.06%) Test Automation
10 27 (15.88%) Infrastructure as Code
11 24 (14.12%) Actionable Insight
11 24 (14.12%) Customer Service
11 24 (14.12%) Enterprise Architecture
11 24 (14.12%) Impact Assessments
11 24 (14.12%) Incident Management
11 24 (14.12%) Information Management
11 24 (14.12%) Systems Analysis
12 23 (13.53%) Migration
Programming Languages
1 98 (57.65%) Java
2 75 (44.12%) PowerShell
3 74 (43.53%) Python
4 44 (25.88%) JavaScript
5 36 (21.18%) C#
6 32 (18.82%) Bash
7 28 (16.47%) Groovy
8 25 (14.71%) Go
9 23 (13.53%) SQL
10 20 (11.76%) Scala
11 15 (8.82%) TypeScript
12 10 (5.88%) Bicep
13 9 (5.29%) Ruby
14 7 (4.12%) Rust
15 3 (1.76%) Shell Script
16 2 (1.18%) ANSI C
16 2 (1.18%) C
16 2 (1.18%) C++
17 1 (0.59%) Perl
Qualifications
1 43 (25.29%) Security Cleared
2 40 (23.53%) SC Cleared
3 14 (8.24%) Degree
4 13 (7.65%) Cisco Certification
5 9 (5.29%) CCNP
6 7 (4.12%) AWS Certification
6 7 (4.12%) AWS Certified DevOps Engineer
6 7 (4.12%) AWS Certified SysOps Administrator
6 7 (4.12%) Azure Certification
6 7 (4.12%) DV Cleared
6 7 (4.12%) Master's Degree
6 7 (4.12%) Microsoft Certification
7 5 (2.94%) BPSS Clearance
7 5 (2.94%) CCIE
8 3 (1.76%) CCSE
8 3 (1.76%) OCP
8 3 (1.76%) Oracle Certification
9 2 (1.18%) CCIE Routing and Switching
9 2 (1.18%) CCNA
10 1 (0.59%) Computer Science Degree
Quality Assurance & Compliance
1 29 (17.06%) SLA
2 9 (5.29%) QA
3 6 (3.53%) Accessibility
4 4 (2.35%) ISO/IEC 27001
5 2 (1.18%) NIST
6 1 (0.59%) GDPR
System Software
1 62 (36.47%) Docker
2 19 (11.18%) Active Directory
3 10 (5.88%) VMware Infrastructure
4 4 (2.35%) vSphere
5 3 (1.76%) Virtual Servers
6 2 (1.18%) VMware NSX
7 1 (0.59%) iptables
7 1 (0.59%) Virtual Machines
Systems Management
1 84 (49.41%) Kubernetes
2 83 (48.82%) Terraform
3 36 (21.18%) Ansible
4 24 (14.12%) AirWatch
4 24 (14.12%) OpenSSO
4 24 (14.12%) Single Sign-On
5 23 (13.53%) Packer
6 20 (11.76%) Prometheus
7 15 (8.82%) Progress Chef
8 14 (8.24%) Istio
9 12 (7.06%) Grafana
9 12 (7.06%) Puppet
10 9 (5.29%) Kibana
10 9 (5.29%) Nagios
11 8 (4.71%) FortiGate
12 7 (4.12%) Argo
13 5 (2.94%) ZABBIX
14 4 (2.35%) Nessus
14 4 (2.35%) WMI
15 3 (1.76%) WhatsUp Gold
Vendors
1 49 (28.82%) Microsoft
2 24 (14.12%) Oracle
3 22 (12.94%) Cisco
3 22 (12.94%) Google
4 16 (9.41%) Dynatrace
4 16 (9.41%) Splunk
5 14 (8.24%) VMware
6 12 (7.06%) Atlassian
7 9 (5.29%) ServiceNow
8 8 (4.71%) Juniper
8 8 (4.71%) New Relic
8 8 (4.71%) Veracode
9 7 (4.12%) Palo Alto
10 6 (3.53%) Meraki
11 5 (2.94%) F5
11 5 (2.94%) SolarWinds
11 5 (2.94%) Sonatype
12 4 (2.35%) CheckPoint
13 3 (1.76%) Adobe
13 3 (1.76%) Rapid7