Lightweight Directory Access Protocol (LDAP)
UK

The following table provides summary statistics for permanent job vacancies with a requirement for LDAP skills. Included is a benchmarking guide to the salaries offered in vacancies that have cited LDAP over the 6 months to 4 December 2023 with a comparison to the same period in the previous 2 years.

6 months to
4 Dec 2023
Same period 2022 Same period 2021
Rank 583 792 803
Rank change year-on-year +209 +11 -222
Permanent jobs citing LDAP 158 286 301
As % of all permanent jobs advertised in the UK 0.30% 0.23% 0.23%
As % of the Libraries, Frameworks & Software Standards category 1.13% 0.71% 0.61%
Number of salaries quoted 102 179 197
10th Percentile £41,250 £42,350 £45,750
25th Percentile £61,250 £47,313 £50,000
Median annual salary (50th Percentile) £82,500 £65,000 £60,000
Median % change year-on-year +26.92% +8.33% -14.29%
75th Percentile £88,750 £88,750 £75,000
90th Percentile £95,000 £95,458 £83,000
UK excluding London median annual salary £68,000 £50,000 £53,350
% change year-on-year +36.00% -6.28% -19.47%

All Software Libraries and Frameworks
UK

LDAP is in the Software Libraries and Frameworks category. The following table is for comparison with the above and provides summary statistics for all permanent job vacancies with a requirement for technical specification, industry standards, software libraries and framework skills.

Permanent vacancies with a requirement for technical specification, industry standards, software libraries and framework skills 14,018 40,128 49,552
As % of all permanent jobs advertised in the UK 26.33% 32.38% 38.64%
Number of salaries quoted 10,969 24,275 32,022
10th Percentile £41,250 £40,000 £36,750
25th Percentile £51,250 £50,000 £45,000
Median annual salary (50th Percentile) £66,500 £65,000 £60,000
Median % change year-on-year +2.31% +8.33% +4.35%
75th Percentile £85,000 £86,250 £80,000
90th Percentile £106,258 £105,000 £96,250
UK excluding London median annual salary £57,500 £57,500 £52,500
% change year-on-year - +9.52% +5.00%

LDAP
Job Vacancy Trend

Job postings citing LDAP as a proportion of all IT jobs advertised.
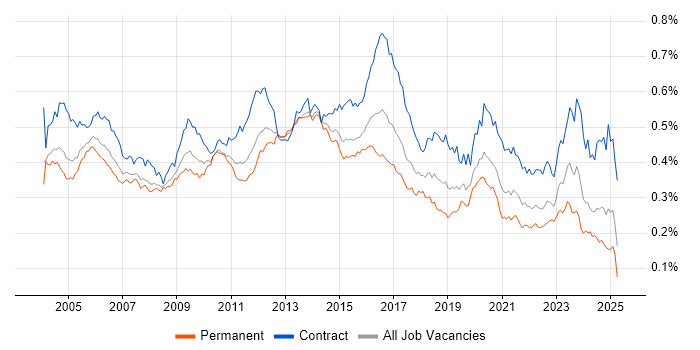
Job vacancy trend for LDAP in the UK

LDAP
Salary Trend

3-month moving average salary quoted in jobs citing LDAP.

Salary trend for LDAP in the UK

LDAP
Salary Histogram

Salary distribution for jobs citing LDAP over the 6 months to 4 December 2023.

Salary histogram for LDAP in the UK

LDAP
Top 15 Job Locations

The table below looks at the demand and provides a guide to the median salaries quoted in IT jobs citing LDAP within the UK over the 6 months to 4 December 2023. The 'Rank Change' column provides an indication of the change in demand within each location based on the same 6 month period last year.

Location Rank Change
on Same Period
Last Year
Matching
Permanent
IT Job Ads
Median Salary
Past 6 Months
Median Salary
% Change
on Same Period
Last Year
Live
Jobs
England +192 118 £82,500 +22.22% 63
UK excluding London +184 78 £68,000 +36.00% 35
Work from Home +203 76 £82,500 +17.86% 111
London +236 68 £82,500 +4.76% 31
Wales - 32 - -
North of England +135 12 £62,500 +32.62% 9
South East +141 9 £66,250 +24.41% 6
East of England +110 8 £82,500 +50.00% 1
North West +98 8 £51,000 +8.22% 3
South West +76 7 £55,500 -30.63% 10
Scotland +52 6 £75,000 +45.90% 6
Midlands +94 4 £45,000 -18.18% 4
Yorkshire +85 4 £82,500 +78.38% 3
West Midlands +114 2 £45,000 -18.18% 3
East Midlands +33 2 - - 1

LDAP
Co-occurring Skills and Capabilities by Category

The follow tables expand on the table above by listing co-occurrences grouped by category. The same employment type, locality and period is covered with up to 20 co-occurrences shown in each of the following categories:

Application Platforms
1 14 (8.86%) SharePoint
2 12 (7.59%) Confluence
3 7 (4.43%) Apache
4 5 (3.16%) OpenStack
5 3 (1.90%) IIS
5 3 (1.90%) MS Exchange
6 1 (0.63%) Apache Solr
6 1 (0.63%) Drupal
6 1 (0.63%) IBM Notes
6 1 (0.63%) JBoss
Applications
1 1 (0.63%) Microsoft Excel
1 1 (0.63%) Microsoft PowerPoint
Business Applications
1 24 (15.19%) Remedy ITSM
Cloud Services
1 28 (17.72%) AWS
1 28 (17.72%) SaaS
2 15 (9.49%) Amazon EKS
2 15 (9.49%) Azure
3 13 (8.23%) OpenShift
4 12 (7.59%) Amazon SQS
4 12 (7.59%) AWS CodeCommit
4 12 (7.59%) BlazeMeter
4 12 (7.59%) Route 53
5 11 (6.96%) Entra ID
6 9 (5.70%) Microsoft 365
7 7 (4.43%) AWS CloudFormation
8 4 (2.53%) Amazon EC2
8 4 (2.53%) Amazon S3
8 4 (2.53%) PaaS
9 3 (1.90%) CloudFront
9 3 (1.90%) IaaS
10 2 (1.27%) Amazon CloudWatch
10 2 (1.27%) Cloud Computing
10 2 (1.27%) GitHub
Communications & Networking
1 77 (48.73%) VPN
2 46 (29.11%) Firewall
3 42 (26.58%) SSL
4 41 (25.95%) Network Security
5 40 (25.32%) TCP/IP
6 39 (24.68%) SMTP
7 38 (24.05%) HTTP
8 37 (23.42%) Internet
9 35 (22.15%) FTP
10 33 (20.89%) LAN
10 33 (20.89%) WAN
11 32 (20.25%) Sourcefire
12 24 (15.19%) Intrusion Detection
13 16 (10.13%) DNS
14 13 (8.23%) Kerberos
15 12 (7.59%) AMQP
16 7 (4.43%) DHCP
16 7 (4.43%) VLAN
17 5 (3.16%) SSH
18 4 (2.53%) Cisco IOS
Database & Business Intelligence
1 19 (12.03%) SQL Server
2 16 (10.13%) Amazon RDS
3 13 (8.23%) MongoDB
4 12 (7.59%) Elasticsearch
4 12 (7.59%) Oracle Database
4 12 (7.59%) Oracle Database 10g
4 12 (7.59%) Oracle Database 11g
5 8 (5.06%) MySQL
6 6 (3.80%) Relational Database
7 2 (1.27%) Amazon Redshift
7 2 (1.27%) Oracle Reports
8 1 (0.63%) DB2
8 1 (0.63%) Microsoft Analysis Services
8 1 (0.63%) PostgreSQL
8 1 (0.63%) Power BI
8 1 (0.63%) SQL Server Analysis Services
8 1 (0.63%) SQL Server Integration Services
Development Applications
1 33 (20.89%) Jenkins
2 27 (17.09%) JIRA
3 26 (16.46%) GitLab
4 25 (15.82%) Git
5 24 (15.19%) Maven
6 13 (8.23%) Artifactory
6 13 (8.23%) Postman
6 13 (8.23%) SonarQube
7 12 (7.59%) ClearCase
7 12 (7.59%) Cucumber
7 12 (7.59%) eggPlant
7 12 (7.59%) JMeter
7 12 (7.59%) JUnit
7 12 (7.59%) Mockito
7 12 (7.59%) REST Assured
7 12 (7.59%) SoapUI
7 12 (7.59%) The Grinder
8 10 (6.33%) LoadRunner
9 2 (1.27%) Bitbucket
General
1 36 (22.78%) Analytical Skills
2 34 (21.52%) Games
3 15 (9.49%) Social Skills
4 11 (6.96%) Inclusion and Diversity
5 7 (4.43%) Finance
6 4 (2.53%) Documentation Skills
6 4 (2.53%) Manufacturing
7 3 (1.90%) Public Sector
7 3 (1.90%) Retail
7 3 (1.90%) Telecoms
8 2 (1.27%) Banking
8 2 (1.27%) Financial Institution
8 2 (1.27%) Legal
9 1 (0.63%) Aerospace
9 1 (0.63%) Electronics
9 1 (0.63%) Law
9 1 (0.63%) Marketing
9 1 (0.63%) Organisational Skills
Job Titles
1 47 (29.75%) Analyst
2 35 (22.15%) SOC Analyst
3 33 (20.89%) Senior
4 28 (17.72%) Consultant
5 26 (16.46%) ServiceNow Consultant
6 25 (15.82%) Technical Consultant
7 24 (15.19%) ITSM Consultant
7 24 (15.19%) Senior Consultant
7 24 (15.19%) Senior ITSM Consultant
7 24 (15.19%) Senior ServiceNow Consultant
7 24 (15.19%) Senior Technical Consultant
8 20 (12.66%) DevOps Engineer
9 13 (8.23%) AWS DevOps
9 13 (8.23%) AWS DevOps Engineer
9 13 (8.23%) AWS Engineer
10 12 (7.59%) Automation Test Analyst
10 12 (7.59%) Test Analyst
11 9 (5.70%) Administrator
12 7 (4.43%) Systems Administrator
13 6 (3.80%) Senior Analyst
Libraries, Frameworks & Software Standards
1 45 (28.48%) XML
2 32 (20.25%) Web Services
3 31 (19.62%) HTML
4 30 (18.99%) SOAP
5 29 (18.35%) CSS
6 28 (17.72%) Ajax
6 28 (17.72%) RabbitMQ
7 25 (15.82%) Middleware
8 16 (10.13%) JSON
9 13 (8.23%) Elastic Stack
9 13 (8.23%) Kafka
10 12 (7.59%) Flask
10 12 (7.59%) Gherkin
10 12 (7.59%) OpenAPI
10 12 (7.59%) REST
10 12 (7.59%) Swagger
10 12 (7.59%) WireMock
11 10 (6.33%) SailPoint
12 8 (5.06%) SAML
13 5 (3.16%) OAuth
Miscellaneous
1 35 (22.15%) Cyber Threat
1 35 (22.15%) Security Operations Centre
2 33 (20.89%) Analytical Mindset
3 32 (20.25%) PKI
4 27 (17.09%) CMDB
5 12 (7.59%) Product Ownership
6 9 (5.70%) Onboarding
7 8 (5.06%) Data Centre
8 3 (1.90%) Enterprise Software
8 3 (1.90%) IoT
8 3 (1.90%) NHS
8 3 (1.90%) Operational Technology
8 3 (1.90%) Replication
8 3 (1.90%) SCADA
9 2 (1.27%) Cyberattack
9 2 (1.27%) Wiki
10 1 (0.63%) Driving Licence
10 1 (0.63%) Private Cloud
10 1 (0.63%) Public Cloud
10 1 (0.63%) Security Posture
Operating Systems
1 50 (31.65%) Linux
2 26 (16.46%) Windows
3 22 (13.92%) Unix
4 9 (5.70%) Ubuntu
4 9 (5.70%) Windows Server
5 5 (3.16%) Mac OS
6 3 (1.90%) CentOS
6 3 (1.90%) Debian
6 3 (1.90%) Solaris
6 3 (1.90%) Windows Server 2012
6 3 (1.90%) Windows Server 2016
6 3 (1.90%) Windows Server 2019
7 2 (1.27%) Red Hat Enterprise Linux
8 1 (0.63%) VMS
Processes & Methodologies
1 45 (28.48%) SIEM
2 39 (24.68%) DevOps
2 39 (24.68%) Multi-Factor Authentication
2 39 (24.68%) Problem-Solving
3 38 (24.05%) Cybersecurity
4 37 (23.42%) Security Operations
5 34 (21.52%) ITSM
6 32 (20.25%) Actionable Insight
6 32 (20.25%) Blue Team
6 32 (20.25%) Compliance Audit
6 32 (20.25%) Data Loss Prevention
6 32 (20.25%) ITIL
6 32 (20.25%) Kalman Filter
6 32 (20.25%) Time Management
6 32 (20.25%) Two-Factor Authentication
7 26 (16.46%) Service Management
8 25 (15.82%) Customer Requirements
8 25 (15.82%) IT Asset Management
9 24 (15.19%) Presales
9 24 (15.19%) Thought Leadership
Programming Languages
1 37 (23.42%) Python
2 33 (20.89%) Java
3 31 (19.62%) JavaScript
4 30 (18.99%) Perl
5 23 (14.56%) SQL
6 14 (8.86%) C#
7 13 (8.23%) C
8 12 (7.59%) Groovy
8 12 (7.59%) Tcl
9 8 (5.06%) Bash
9 8 (5.06%) Shell Script
10 7 (4.43%) PowerShell
11 1 (0.63%) Bicep
11 1 (0.63%) C++
11 1 (0.63%) Data Analysis Expressions
11 1 (0.63%) PHP
11 1 (0.63%) VB.NET
Qualifications
1 69 (43.67%) Security Cleared
2 39 (24.68%) SC Cleared
3 31 (19.62%) Degree
4 4 (2.53%) Computer Science Degree
4 4 (2.53%) DV Cleared
4 4 (2.53%) ITIL Foundation Certificate
Quality Assurance & Compliance
1 13 (8.23%) QA
2 3 (1.90%) DICOM
2 3 (1.90%) HL7
3 2 (1.27%) GRC
3 2 (1.27%) ISO/IEC 27001
4 1 (0.63%) Cyber Essentials
4 1 (0.63%) Cyber Essentials PLUS
4 1 (0.63%) NIST
4 1 (0.63%) RMADS
4 1 (0.63%) SLA
System Software
1 41 (25.95%) Active Directory
2 23 (14.56%) Docker
3 13 (8.23%) VMware Infrastructure
4 12 (7.59%) Apache ZooKeeper
5 10 (6.33%) Hyper-V
6 4 (2.53%) KVM
7 3 (1.90%) Ceph
7 3 (1.90%) Shibboleth
7 3 (1.90%) Slurm Workload Manager
8 2 (1.27%) ACF2
8 2 (1.27%) IAG
8 2 (1.27%) RACF
9 1 (0.63%) NFS
9 1 (0.63%) Varnish
9 1 (0.63%) Virtual Machines
Systems Management
1 35 (22.15%) FortiGate
2 31 (19.62%) Ansible
3 25 (15.82%) Kubernetes
4 24 (15.19%) HP UCMDB
5 18 (11.39%) Terraform
6 12 (7.59%) Kustomize
6 12 (7.59%) Single Sign-On
7 10 (6.33%) HP Quality Center
8 9 (5.70%) Puppet
9 8 (5.06%) Progress Chef
10 5 (3.16%) Jamf Pro
10 5 (3.16%) Microsoft Intune
11 4 (2.53%) Nagios
11 4 (2.53%) SCOM
12 3 (1.90%) Ganglia
13 2 (1.27%) Packer
13 2 (1.27%) PingFederate
13 2 (1.27%) Salt
14 1 (0.63%) Active Directory Federation Services
14 1 (0.63%) Grafana
Vendors
1 46 (29.11%) Cisco
2 43 (27.22%) Splunk
3 41 (25.95%) ServiceNow
4 36 (22.78%) Juniper
5 35 (22.15%) HP
6 32 (20.25%) ArcSight
6 32 (20.25%) CheckPoint
6 32 (20.25%) F5
6 32 (20.25%) IBM
6 32 (20.25%) TippingPoint
6 32 (20.25%) Trend Micro
7 24 (15.19%) BMC
7 24 (15.19%) Remedy
8 14 (8.86%) Microsoft
8 14 (8.86%) Oracle
9 13 (8.23%) AppDynamics
9 13 (8.23%) VMware
10 12 (7.59%) MKS
11 8 (5.06%) Red Hat
12 5 (3.16%) Centrify