FMCG Jobs with Hybrid/Remote/WFH Options

Fast Moving Consumer Goods (FMCG)
UK > Work from Home

The table below looks at the prevalence of the term FMCG in remote or hybrid work. Included is a benchmarking guide to the salaries offered in vacancies that cited FMCG over the 6 months leading up to 17 May 2025, comparing them to the same period in the previous two years.

6 months to
17 May 2025
Same period 2024 Same period 2023
Rank 432 496 537
Rank change year-on-year +64 +41 +39
Permanent jobs citing FMCG 32 98 126
As % of all permanent jobs with a WFH option 0.17% 0.29% 0.31%
As % of the Miscellaneous category 0.41% 0.81% 0.80%
Number of salaries quoted 29 86 52
10th Percentile £31,750 £43,750 £33,000
25th Percentile £33,250 £50,000 £40,000
Median annual salary (50th Percentile) £57,500 £72,500 £53,500
Median % change year-on-year -20.69% +35.51% -
75th Percentile £78,750 £95,000 £65,000
90th Percentile £97,050 £97,500 £110,000
UK median annual salary £56,250 £60,000 £65,000
% change year-on-year -6.25% -7.69% +18.18%

All Generic Skills
Work from Home

FMCG falls under the General and Transferable Skills category. For comparison with the information above, the following table provides summary statistics for all permanent job vacancies with remote or hybrid options requiring generic IT skills.

Permanent vacancies with a requirement for generic IT skills 7,775 12,067 15,678
As % of all permanent jobs with a WFH option 41.78% 35.71% 38.58%
Number of salaries quoted 3,810 9,254 11,425
10th Percentile £33,000 £32,500 £39,250
25th Percentile £46,750 £42,500 £48,750
Median annual salary (50th Percentile) £65,000 £59,526 £65,000
Median % change year-on-year +9.20% -8.42% -
75th Percentile £85,000 £80,000 £86,250
90th Percentile £122,500 £102,500 £107,500
UK median annual salary £60,000 £55,000 £65,000
% change year-on-year +9.09% -15.38% +4.00%

FMCG
Trend for Jobs with a WFH Option

Job vacancies with remote working options citing FMCG as a proportion of all IT jobs advertised.
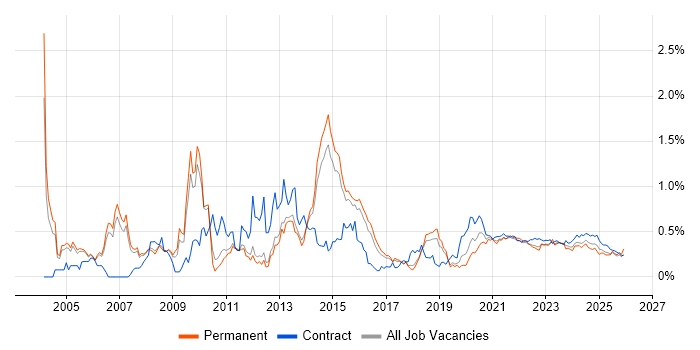
FMCG trend for jobs with Hybrid/Remote/WFH options

FMCG
Salary Trend for Jobs with a WFH Option

3-month moving average salary quoted in job vacancies with remote working options citing FMCG.

FMCG salary trend for jobs with a WFH option

FMCG
Salary Histogram for Jobs with a WFH Option

Salary distribution for jobs with remote working options citing FMCG over the 6 months to 17 May 2025.

FMCG salary histogram for jobs with a WFH option

FMCG
Co-occurring Skills and Capabilities with WFH Options by Category

The follow tables expand on the table above by listing co-occurrences grouped by category. The same employment type, locality and period is covered with up to 20 co-occurrences shown in each of the following categories:

Application Platforms
1 11 (34.38%) Microsoft Exchange
2 10 (31.25%) SharePoint
Applications
1 1 (3.13%) Adobe After Effects
1 1 (3.13%) Adobe Creative Suite
1 1 (3.13%) Adobe Illustrator
1 1 (3.13%) Adobe Premiere
1 1 (3.13%) Blender
1 1 (3.13%) CINEMA 4D
1 1 (3.13%) InDesign
1 1 (3.13%) Photoshop
Business Applications
1 4 (12.50%) IBM Planning Analytics
2 2 (6.25%) SAP S/4HANA
Cloud Services
1 9 (28.13%) Microsoft 365
2 8 (25.00%) Microsoft Copilot
3 5 (15.63%) Power Platform
4 2 (6.25%) Azure
5 1 (3.13%) Entra ID
5 1 (3.13%) PowerApps
Communications & Networking
1 8 (25.00%) Firewall
Database & Business Intelligence
1 4 (12.50%) Power BI
2 2 (6.25%) MySQL
2 2 (6.25%) Oracle BI Publisher
2 2 (6.25%) QlikView
2 2 (6.25%) SQL Server
2 2 (6.25%) Tableau
General
1 23 (71.88%) Manufacturing
2 14 (43.75%) Finance
3 12 (37.50%) Social Skills
4 10 (31.25%) Retail
5 2 (6.25%) Automotive
5 2 (6.25%) Law
5 2 (6.25%) Publishing
6 1 (3.13%) Advertising
6 1 (3.13%) Analytical Skills
6 1 (3.13%) Banking
6 1 (3.13%) Inclusion and Diversity
6 1 (3.13%) Influencing Skills
6 1 (3.13%) Marketing
6 1 (3.13%) Pharmaceutical
Job Titles
1 13 (40.63%) Analyst
2 8 (25.00%) 2nd Line Support
2 8 (25.00%) 2nd Line Support Analyst
2 8 (25.00%) IT Analyst
2 8 (25.00%) IT Support
2 8 (25.00%) IT Support Analyst
2 8 (25.00%) Support Analyst
3 4 (12.50%) Product Owner
4 3 (9.38%) Architect
5 2 (6.25%) .NET Developer
5 2 (6.25%) Business Systems Manager
5 2 (6.25%) Communications Manager
5 2 (6.25%) Enterprise Architect
5 2 (6.25%) IT Manager
5 2 (6.25%) Operations Analyst
5 2 (6.25%) Project Manager
5 2 (6.25%) SQL Developer
5 2 (6.25%) Systems Analyst
5 2 (6.25%) Systems Manager
5 2 (6.25%) VB.NET Developer
Libraries, Frameworks & Software Standards
1 2 (6.25%) .NET
1 2 (6.25%) Oracle Fusion
Miscellaneous
1 8 (25.00%) Self-Motivation
2 4 (12.50%) Product Ownership
3 3 (9.38%) Onboarding
4 1 (3.13%) Animation
4 1 (3.13%) Blockchain
4 1 (3.13%) e-Learning
4 1 (3.13%) Graphic Design
4 1 (3.13%) IoT
4 1 (3.13%) Legacy Systems
4 1 (3.13%) Motion Graphics
4 1 (3.13%) PKI
4 1 (3.13%) Social Media
Operating Systems
1 10 (31.25%) Windows
1 10 (31.25%) Windows Server
2 8 (25.00%) Windows Server 2019
Processes & Methodologies
1 11 (34.38%) ERP
2 7 (21.88%) Business Intelligence
2 7 (21.88%) Logistics
3 5 (15.63%) Project Management
4 4 (12.50%) Analytics
4 4 (12.50%) Problem-Solving
4 4 (12.50%) Stakeholder Engagement
5 3 (9.38%) Stakeholder Management
6 2 (6.25%) Agile
6 2 (6.25%) Change Control
6 2 (6.25%) Change Management
6 2 (6.25%) Computer Science
6 2 (6.25%) Continuous Improvement
6 2 (6.25%) Contract Negotiation
6 2 (6.25%) Integration Testing
6 2 (6.25%) Mathematics
6 2 (6.25%) Procure-to-Pay
6 2 (6.25%) Strategic Management
6 2 (6.25%) User Acceptance Testing
6 2 (6.25%) Visualisation
Programming Languages
1 6 (18.75%) SQL
2 2 (6.25%) C#
2 2 (6.25%) VB.NET
3 1 (3.13%) PowerShell
Qualifications
1 5 (15.63%) Degree
2 2 (6.25%) Computer Science Degree
3 1 (3.13%) Master's Degree
3 1 (3.13%) MBA
3 1 (3.13%) PMI Certification
3 1 (3.13%) PMP
3 1 (3.13%) Postgraduate
3 1 (3.13%) TOGAF Certification
Quality Assurance & Compliance
1 2 (6.25%) GDPR
2 1 (3.13%) PMO
System Software
1 3 (9.38%) Active Directory
2 2 (6.25%) Terminal Server
Systems Management
1 1 (3.13%) Microsoft Intune
Vendors
1 4 (12.50%) IBM
2 2 (6.25%) Citrix
2 2 (6.25%) Concur
2 2 (6.25%) Infor
2 2 (6.25%) Oracle
2 2 (6.25%) SAP
3 1 (3.13%) Adobe
3 1 (3.13%) Ariba
3 1 (3.13%) Informatica
3 1 (3.13%) Microsoft
3 1 (3.13%) Salesforce
3 1 (3.13%) Sparx