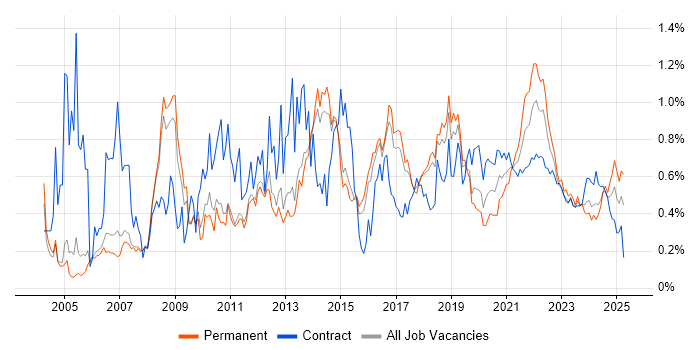
Publishing Jobs with Work from Home Options

Publishing
UK > Work from Home

The table below looks at the prevalence of the term Publishing in permanent job vacancies with an option to work from home (WFH). Included is a benchmarking guide to the salaries offered in vacancies that have cited Publishing over the 6 months to 28 April 2024 with a comparison to the same period over the previous 2 years.

6 months to
28 Apr 2024
Same period 2023 Same period 2022
Rank 431 481 300
Rank change year-on-year +50 -181 +117
Permanent jobs citing Publishing 157 191 810
As % of all permanent jobs with a WFH option 0.47% 0.45% 1.21%
As % of the General category 0.76% 0.68% 1.94%
Number of salaries quoted 129 123 337
10th Percentile £31,250 £37,750 £38,750
25th Percentile £38,750 £47,250 £46,950
Median annual salary (50th Percentile) £47,500 £55,000 £60,000
Median % change year-on-year -13.64% -8.33% +4.35%
75th Percentile £60,741 £70,625 £77,500
90th Percentile £77,500 £82,500 £89,750
UK median annual salary £45,210 £57,500 £60,000
% change year-on-year -21.37% -4.17% +4.35%

All General Skills
Work from Home

Publishing is in the General Skills category. The following table is for comparison with the above and provides summary statistics for all permanent job vacancies with a WFH option and a requirement for common skills.

Permanent vacancies with a requirement for common skills 20,706 28,282 41,722
As % of all permanent jobs with a WFH option 61.34% 66.10% 62.36%
Number of salaries quoted 15,095 18,810 24,334
10th Percentile £31,750 £36,250 £35,000
25th Percentile £41,750 £46,570 £45,000
Median annual salary (50th Percentile) £55,000 £62,500 £60,000
Median % change year-on-year -12.00% +4.17% +9.09%
75th Percentile £75,000 £82,500 £78,750
90th Percentile £95,000 £101,325 £95,000
UK median annual salary £52,500 £60,000 £60,000
% change year-on-year -12.50% - +9.09%

Publishing
Trend for Jobs with a WFH Option

Job vacancies with a work from home option citing Publishing as a proportion of all IT jobs advertised.

Publishing trend for jobs with a WFH option

Publishing
Salary Trend for Jobs with a WFH Option

3-month moving average salary quoted in job vacancies with a work from home option citing Publishing.

Publishing salary trend for jobs with a WFH option

Publishing
Salary Histogram for Jobs with a WFH Option

Salary distribution for jobs with a work from home option citing Publishing over the 6 months to 28 April 2024.

Publishing salary histogram for jobs with a WFH option

Publishing
Co-occurring Skills and Capabilities with WFH Options by Category

The follow tables expand on the table above by listing co-occurrences grouped by category. The same employment type, locality and period is covered with up to 20 co-occurrences shown in each of the following categories:

Application Platforms
1 19 (12.10%) CMS
2 17 (10.83%) WordPress
3 7 (4.46%) Apache
4 6 (3.82%) Confluence
4 6 (3.82%) Drupal
4 6 (3.82%) SharePoint
5 4 (2.55%) Microsoft Exchange
6 2 (1.27%) Joomla!
6 2 (1.27%) Umbraco
7 1 (0.64%) Kentico
Applications
1 10 (6.37%) Photoshop
2 7 (4.46%) Adobe Illustrator
3 6 (3.82%) Adobe Creative Suite
4 5 (3.18%) InDesign
4 5 (3.18%) Microsoft Excel
5 4 (2.55%) Adobe XD
5 4 (2.55%) Microsoft Office
5 4 (2.55%) Sketch
6 2 (1.27%) Adobe Premiere
7 1 (0.64%) Windchill
Business Applications
1 3 (1.91%) Dynamics CRM
2 1 (0.64%) Primavera
2 1 (0.64%) Yoast SEO
Cloud Services
1 32 (20.38%) AWS
2 27 (17.20%) Azure
3 12 (7.64%) Azure DevOps
4 11 (7.01%) Figma
5 10 (6.37%) SaaS
6 9 (5.73%) Microsoft 365
7 8 (5.10%) Google Analytics
8 6 (3.82%) PaaS
9 5 (3.18%) Cloud Computing
9 5 (3.18%) GitHub
9 5 (3.18%) Power Platform
10 4 (2.55%) AWS Direct Connect
10 4 (2.55%) Entra ID
10 4 (2.55%) WhatsApp
11 3 (1.91%) Canva
11 3 (1.91%) MailChimp
12 2 (1.27%) Azure Synapse Analytics
12 2 (1.27%) ClickUp
12 2 (1.27%) OCI
12 2 (1.27%) OneDrive
Communications & Networking
1 7 (4.46%) DHCP
1 7 (4.46%) DNS
2 6 (3.82%) Firewall
2 6 (3.82%) LAN
2 6 (3.82%) WAN
3 4 (2.55%) BGP
3 4 (2.55%) Cisco ASA
3 4 (2.55%) Cisco IPT
3 4 (2.55%) Cisco Nexus
3 4 (2.55%) Cisco Wireless
3 4 (2.55%) DMVPN
3 4 (2.55%) EIGRP
3 4 (2.55%) Network Security
3 4 (2.55%) OSPF
3 4 (2.55%) SD-WAN
3 4 (2.55%) VLAN
3 4 (2.55%) VXLAN
3 4 (2.55%) Wireless
4 2 (1.27%) Wi-Fi
Database & Business Intelligence
1 15 (9.55%) MySQL
1 15 (9.55%) Relational Database
2 7 (4.46%) Elasticsearch
3 5 (3.18%) DTS
3 5 (3.18%) Power BI
3 5 (3.18%) SQL Server
4 4 (2.55%) MS Access
5 2 (1.27%) Data Lake
5 2 (1.27%) Metadata
6 1 (0.64%) Metadata Repository
6 1 (0.64%) OLAP
6 1 (0.64%) Semantic Layer
Development Applications
1 15 (9.55%) Maven
2 12 (7.64%) Visual Studio
3 7 (4.46%) Git
3 7 (4.46%) JIRA
4 6 (3.82%) Postman
4 6 (3.82%) SoapUI
5 2 (1.27%) PowerBuilder
6 1 (0.64%) Cypress.io
General
1 59 (37.58%) Social Skills
2 40 (25.48%) Marketing
3 38 (24.20%) Finance
4 25 (15.92%) Analytical Skills
5 22 (14.01%) Inclusion and Diversity
6 20 (12.74%) Legal
7 17 (10.83%) Law
8 16 (10.19%) Banking
9 15 (9.55%) Investment Banking
10 12 (7.64%) Retail
11 8 (5.10%) Documentation Skills
12 7 (4.46%) Automotive
13 6 (3.82%) Organisational Skills
14 5 (3.18%) Public Sector
14 5 (3.18%) Social Science
15 3 (1.91%) Advertising
16 2 (1.27%) Presentation Skills
17 1 (0.64%) Aerospace
17 1 (0.64%) Esports
17 1 (0.64%) Games
Job Titles
1 36 (22.93%) Senior
2 19 (12.10%) Developer
2 19 (12.10%) Software Engineer
3 15 (9.55%) IT Manager
3 15 (9.55%) Senior Manager
4 14 (8.92%) Analyst
5 13 (8.28%) Software Developer
6 12 (7.64%) .NET Developer
6 12 (7.64%) Change Manager
6 12 (7.64%) IT Change Manager
6 12 (7.64%) Senior Change Manager
6 12 (7.64%) Senior IT Manager
7 11 (7.01%) Research Engineer
7 11 (7.01%) Research Software Engineer
8 8 (5.10%) Author
8 8 (5.10%) Designer
8 8 (5.10%) Project Manager
8 8 (5.10%) Technical Author
9 7 (4.46%) Business Analyst
9 7 (4.46%) Senior Developer
Libraries, Frameworks & Software Standards
1 19 (12.10%) React
2 18 (11.46%) .NET
3 15 (9.55%) .NET Framework
3 15 (9.55%) CSS
3 15 (9.55%) HTML
3 15 (9.55%) Spring
3 15 (9.55%) Spring Boot
4 13 (8.28%) XML
5 10 (6.37%) .NET Core
6 9 (5.73%) WCF
7 7 (4.46%) Apache NiFi
8 6 (3.82%) AngularJS
8 6 (3.82%) ASP.NET
8 6 (3.82%) JSON
8 6 (3.82%) RESTful
8 6 (3.82%) SOAP
8 6 (3.82%) Twitter Bootstrap
8 6 (3.82%) WPF
8 6 (3.82%) XSD
8 6 (3.82%) XSLT
Miscellaneous
1 21 (13.38%) Distributed Applications
2 15 (9.55%) Cloud Native
2 15 (9.55%) Social Media
3 13 (8.28%) Enterprise Software
4 10 (6.37%) Management Information System
5 9 (5.73%) Data Centre
6 7 (4.46%) Data Structures
7 6 (3.82%) Blog
7 6 (3.82%) FMCG
7 6 (3.82%) Product Ownership
8 5 (3.18%) Private Cloud
9 4 (2.55%) Hybrid Cloud
10 3 (1.91%) Graphic Design
10 3 (1.91%) Photography
10 3 (1.91%) Video Editing
11 2 (1.27%) Algorithms
11 2 (1.27%) Data Protection Act
11 2 (1.27%) e-Learning
11 2 (1.27%) Podcast
11 2 (1.27%) Reference Data
Operating Systems
1 13 (8.28%) Windows
2 3 (1.91%) Apple iOS
3 2 (1.27%) Mac OS
3 2 (1.27%) Windows 10
3 2 (1.27%) Windows Server
3 2 (1.27%) Windows Vista
4 1 (0.64%) Android
Processes & Methodologies
1 54 (34.39%) Agile
2 37 (23.57%) Problem-Solving
3 25 (15.92%) Stakeholder Management
4 21 (13.38%) OOP
4 21 (13.38%) SDLC
4 21 (13.38%) Software Engineering
5 20 (12.74%) Content Management
6 19 (12.10%) Coaching
6 19 (12.10%) DevOps
6 19 (12.10%) Fintech
7 18 (11.46%) IT Strategy
7 18 (11.46%) Mentoring
8 17 (10.83%) Analytics
9 16 (10.19%) MVC
10 15 (9.55%) Customer Service
10 15 (9.55%) Full Stack Development
10 15 (9.55%) OO
10 15 (9.55%) Technology Strategy
11 14 (8.92%) Change Management
12 13 (8.28%) Risk Management
Programming Languages
1 32 (20.38%) JavaScript
2 30 (19.11%) Python
3 25 (15.92%) SQL
4 24 (15.29%) Java
5 16 (10.19%) C#
6 15 (9.55%) Groovy
6 15 (9.55%) T-SQL
7 7 (4.46%) Go
8 6 (3.82%) TypeScript
9 5 (3.18%) PowerShell
10 3 (1.91%) PHP
10 3 (1.91%) VB.NET
11 1 (0.64%) Kotlin
11 1 (0.64%) Swift
Qualifications
1 18 (11.46%) Degree
2 13 (8.28%) Security Cleared
3 9 (5.73%) SC Cleared
4 6 (3.82%) Computer Science Degree
4 6 (3.82%) DV Cleared
4 6 (3.82%) HNC
5 4 (2.55%) CCNA
5 4 (2.55%) CCNP
5 4 (2.55%) Cisco Certification
6 3 (1.91%) DBS Check
7 2 (1.27%) CompTIA Security+
8 1 (0.64%) CCIP
8 1 (0.64%) Numerate Degree
Quality Assurance & Compliance
1 15 (9.55%) QA
2 6 (3.82%) GDPR
2 6 (3.82%) ISO 20022
2 6 (3.82%) PSD2
3 4 (2.55%) Cyber Essentials
3 4 (2.55%) ISO/IEC 27001
4 2 (1.27%) Accessibility
4 2 (1.27%) Actionable Recommendations
4 2 (1.27%) Cyber Essentials PLUS
4 2 (1.27%) NCSC
4 2 (1.27%) PCI DSS
4 2 (1.27%) PMO
System Software
1 9 (5.73%) Active Directory
2 7 (4.46%) Docker
3 5 (3.18%) DFS Replication
Systems Management
1 15 (9.55%) Terraform
2 7 (4.46%) Ansible
2 7 (4.46%) Kibana
3 2 (1.27%) CASB
3 2 (1.27%) Microsoft Intune
4 1 (0.64%) SCOM
Vendors
1 21 (13.38%) Microsoft
2 12 (7.64%) Adobe
3 10 (6.37%) Google
4 7 (4.46%) Facebook
4 7 (4.46%) Instagram
5 6 (3.82%) Atlassian
6 5 (3.18%) TikTok
7 4 (2.55%) CheckPoint
7 4 (2.55%) Cisco
7 4 (2.55%) Oracle
7 4 (2.55%) YouTube
8 3 (1.91%) Databricks
8 3 (1.91%) Twitter
9 2 (1.27%) Apple
9 2 (1.27%) Cadence
9 2 (1.27%) Salesforce