Use Case Contracts in London

Use Cases
England > London

The table below provides summary statistics for contract job vacancies advertised in London requiring Use Case skills. It includes a benchmarking guide to the contractor rates offered in vacancies that cited Use Case over the 6 months leading up to 29 May 2025, comparing them to the same period in the previous two years.

6 months to
29 May 2025
Same period 2024 Same period 2023
Rank 158 163 171
Rank change year-on-year +5 +8 +15
Contract jobs citing Use Case 207 284 387
As % of all contract jobs advertised in London 1.71% 1.63% 1.52%
As % of the Processes & Methodologies category 1.85% 1.84% 1.67%
Number of daily rates quoted 130 184 261
10th Percentile £400 £412 £423
25th Percentile £501 £500 £500
Median daily rate (50th Percentile) £625 £581 £600
Median % change year-on-year +7.53% -3.13% -
75th Percentile £794 £678 £700
90th Percentile £881 £851 £825
England median daily rate £575 £563 £550
% change year-on-year +2.22% +2.27% -3.51%
Number of hourly rates quoted 0 0 1
Median hourly rate - - £90.00
England median hourly rate £56.25 £60.00 £70.00
% change year-on-year -6.25% -14.29% +17.65%

All Process and Methodology Skills
London

Use Case falls under the Processes and Methodologies category. For comparison with the information above, the following table provides summary statistics for all contract job vacancies requiring process or methodology skills in London.

Contract vacancies with a requirement for process or methodology skills 11,178 15,459 23,168
As % of all contract IT jobs advertised in London 92.22% 88.48% 90.85%
Number of daily rates quoted 7,507 11,105 16,762
10th Percentile £350 £340 £375
25th Percentile £431 £450 £475
Median daily rate (50th Percentile) £550 £550 £590
Median % change year-on-year - -6.78% +2.61%
75th Percentile £688 £675 £700
90th Percentile £800 £800 £800
England median daily rate £525 £525 £550
% change year-on-year - -4.55% +1.85%
Number of hourly rates quoted 187 316 266
10th Percentile £16.50 £15.72 £18.25
25th Percentile £23.78 £20.00 £22.50
Median hourly rate £30.81 £28.00 £39.63
Median % change year-on-year +10.02% -29.34% +12.29%
75th Percentile £49.75 £48.75 £64.50
90th Percentile £63.10 £66.88 £82.50
England median hourly rate £28.00 £37.18 £37.32
% change year-on-year -24.69% -0.38% +49.28%

Use Case
Job Vacancy Trend in London

Job postings citing Use Case as a proportion of all IT jobs advertised in London.
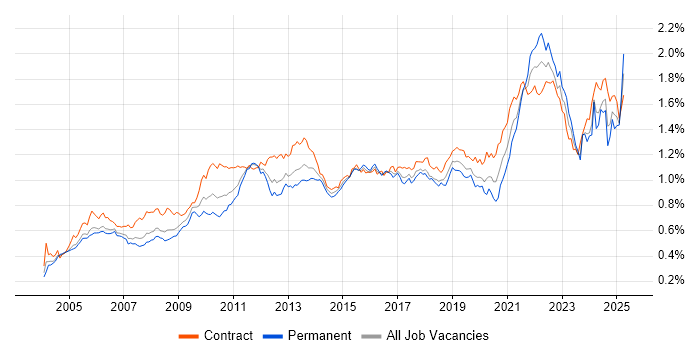
Job vacancy trend for Use Case in London

Use Case
Contractor Daily Rate Trend in London

3-month moving average daily rate quoted in jobs citing Use Case in London.

Daily rate trend for Use Case in London

Use Case
Daily Rate Histogram in London

Daily rate distribution for jobs citing Use Case in London over the 6 months to 29 May 2025.

Daily rate histogram for Use Case in London

Use Case
Contractor Hourly Rate Trend in London

3-month moving average hourly rates quoted in jobs citing Use Case in London.

Hourly rate trend for Use Case in London

Use Case
Contract Job Locations in London

The table below looks at the demand and provides a guide to the median contractor rates quoted in IT jobs citing Use Case within the London region over the 6 months to 29 May 2025. The 'Rank Change' column provides an indication of the change in demand within each location based on the same 6 month period last year.

Location Rank Change
on Same Period
Last Year
Matching
Contract
IT Job Ads
Median
Daily Rate
Past 6 Months
Median Daily Rate
% Change
on Same Period
Last Year
Live
Jobs
Central London +2 28 £675 +12.50% 28
East London +16 3 £585 +8.33% 8
South London +7 2 £750 - 4
Use Case
England

Use Case
Co-occurring Skills and Capabilities in London by Category

The follow tables expand on the table above by listing co-occurrences grouped by category. The same employment type, locality and period is covered with up to 20 co-occurrences shown in each of the following categories:

Application Platforms
1 12 (5.80%) Confluence
2 3 (1.45%) CMS
3 2 (0.97%) Jupyter
4 1 (0.48%) Apache
4 1 (0.48%) Apache Airflow
4 1 (0.48%) Apache Spark
4 1 (0.48%) SharePoint
Applications
1 10 (4.83%) Microsoft Excel
1 10 (4.83%) MS Visio
2 8 (3.86%) Microsoft Office
3 5 (2.42%) Microsoft Project
4 4 (1.93%) Microsoft PowerPoint
5 2 (0.97%) Adobe Creative Suite
Business Applications
1 12 (5.80%) Endur
2 10 (4.83%) SAP S/4HANA
3 8 (3.86%) SAP PS
4 2 (0.97%) SAP FI
5 1 (0.48%) Aligne
5 1 (0.48%) Dynamics CRM
5 1 (0.48%) Dynamics NAV
5 1 (0.48%) Kondor
5 1 (0.48%) Orchestrade
5 1 (0.48%) SAP LE
5 1 (0.48%) SAP MDG
5 1 (0.48%) SAP PP
5 1 (0.48%) Shopify
Cloud Services
1 44 (21.26%) AWS
2 34 (16.43%) Azure
3 22 (10.63%) SaaS
4 21 (10.14%) Amazon S3
5 15 (7.25%) Amazon EC2
6 14 (6.76%) Amazon SQS
6 14 (6.76%) GCP
7 11 (5.31%) Azure DevOps
8 10 (4.83%) Power Platform
9 4 (1.93%) Vertex AI
10 3 (1.45%) Amazon ELB
10 3 (1.45%) Amazon SageMaker
10 3 (1.45%) Azure Synapse Analytics
10 3 (1.45%) dbt
10 3 (1.45%) Entra ID
10 3 (1.45%) Snowflake
11 2 (0.97%) Adobe Creative Cloud
11 2 (0.97%) AWS CloudFormation
11 2 (0.97%) GitHub
11 2 (0.97%) Serverless
Communications & Networking
1 7 (3.38%) Firewall
2 5 (2.42%) Network Security
3 3 (1.45%) HTTP
3 3 (1.45%) Software-Defined Networking
4 1 (0.48%) LAN
4 1 (0.48%) Wi-Fi
4 1 (0.48%) Wireless
4 1 (0.48%) WLAN
Database & Business Intelligence
1 14 (6.76%) Data Warehouse
2 11 (5.31%) Tableau
3 10 (4.83%) Power BI
4 9 (4.35%) Big Data
5 6 (2.90%) Amazon Redshift
6 5 (2.42%) Data Mart
6 5 (2.42%) Data Vault
7 4 (1.93%) NoSQL
7 4 (1.93%) RDBMS
7 4 (1.93%) Relational Database
8 3 (1.45%) Data Lake
9 2 (0.97%) Metadata
9 2 (0.97%) PostgreSQL
9 2 (0.97%) Power Query
9 2 (0.97%) PowerPivot
9 2 (0.97%) SQL Server
10 1 (0.48%) DataStage
10 1 (0.48%) DB2
10 1 (0.48%) Hadoop
10 1 (0.48%) Snowflake Schema
Development Applications
1 20 (9.66%) Jenkins
2 14 (6.76%) JIRA
3 4 (1.93%) Git
4 3 (1.45%) Bitbucket
5 1 (0.48%) Eclipse
5 1 (0.48%) Gatling
5 1 (0.48%) IBM UrbanCode
5 1 (0.48%) JMeter
5 1 (0.48%) Katalon Studio
5 1 (0.48%) LoadRunner
5 1 (0.48%) MLflow
5 1 (0.48%) Postman
General
1 72 (34.78%) Finance
2 62 (29.95%) Analytical Skills
3 50 (24.15%) Social Skills
4 34 (16.43%) Banking
5 18 (8.70%) Investment Banking
6 17 (8.21%) Organisational Skills
7 14 (6.76%) Documentation Skills
7 14 (6.76%) Public Sector
8 13 (6.28%) Marketing
9 11 (5.31%) Presentation Skills
10 9 (4.35%) Front Office
10 9 (4.35%) Legal
11 8 (3.86%) Aerospace
11 8 (3.86%) Back Office
11 8 (3.86%) Influencing Skills
12 6 (2.90%) Financial Institution
13 5 (2.42%) Retail
14 4 (1.93%) Inclusion and Diversity
15 3 (1.45%) Corporate Banking
15 3 (1.45%) Military
Job Titles
1 60 (28.99%) Analyst
2 41 (19.81%) Business Analyst
3 37 (17.87%) Architect
4 32 (15.46%) Developer
5 20 (9.66%) Python Developer
6 19 (9.18%) Gen AI Developer
7 18 (8.70%) Artificial Intelligence Developer
8 17 (8.21%) Consultant
8 17 (8.21%) Security Architect
9 15 (7.25%) Senior
10 13 (6.28%) Lead
11 11 (5.31%) Data Analyst
12 10 (4.83%) Senior Analyst
13 7 (3.38%) Senior Business Analyst
14 6 (2.90%) Data Architect
14 6 (2.90%) Gen AI Engineer
15 5 (2.42%) Data Engineer
15 5 (2.42%) Data Modeller
15 5 (2.42%) Functional Consultant
15 5 (2.42%) Python Engineer
Libraries, Frameworks & Software Standards
1 26 (12.56%) React
2 22 (10.63%) FastAPI
3 20 (9.66%) Django
4 19 (9.18%) .NET
5 8 (3.86%) LangChain
6 7 (3.38%) HTML
7 6 (2.90%) Bootstrap
7 6 (2.90%) CSS
8 5 (2.42%) Dask
8 5 (2.42%) NumPy
8 5 (2.42%) Pandas
9 4 (1.93%) Ajax
9 4 (1.93%) Node.js
10 3 (1.45%) REST
10 3 (1.45%) Web Services
11 2 (0.97%) AngularJS
11 2 (0.97%) J2EE
11 2 (0.97%) jQuery
11 2 (0.97%) Struts
11 2 (0.97%) TensorFlow
Miscellaneous
1 26 (12.56%) Onboarding
2 16 (7.73%) Security Operations Centre
3 15 (7.25%) CSOC
4 10 (4.83%) Product Ownership
5 8 (3.86%) Greenfield Project
6 6 (2.90%) Legacy Systems
7 5 (2.42%) Reinsurance
8 4 (1.93%) Analytical Mindset
8 4 (1.93%) Data Fabric
8 4 (1.93%) FMCG
8 4 (1.93%) Management Information System
8 4 (1.93%) PMI
9 3 (1.45%) CMDB
9 3 (1.45%) Hybrid Cloud
9 3 (1.45%) Security Posture
10 2 (0.97%) Data Structures
10 2 (0.97%) Enterprise Software
10 2 (0.97%) Life Science
10 2 (0.97%) Mobile App
10 2 (0.97%) Public Cloud
Operating Systems
1 3 (1.45%) Linux
1 3 (1.45%) Windows
2 1 (0.48%) Android
2 1 (0.48%) SUSE
Processes & Methodologies
1 76 (36.71%) Agile
2 47 (22.71%) Artificial Intelligence
3 38 (18.36%) DevOps
4 37 (17.87%) Machine Learning
5 34 (16.43%) Analytics
5 34 (16.43%) Generative AI
6 30 (14.49%) Stakeholder Management
7 28 (13.53%) CI/CD
7 28 (13.53%) Problem-Solving
7 28 (13.53%) User Stories
8 26 (12.56%) Cybersecurity
9 24 (11.59%) Business Analysis
9 24 (11.59%) Continuous Improvement
10 23 (11.11%) LLM
10 23 (11.11%) SIEM
11 22 (10.63%) SDLC
12 21 (10.14%) Technical Analysis
13 20 (9.66%) Data Modelling
14 18 (8.70%) Business Intelligence
14 18 (8.70%) Workshop Facilitation
Programming Languages
1 55 (26.57%) Python
2 54 (26.09%) SQL
3 24 (11.59%) TypeScript
4 23 (11.11%) Java
5 17 (8.21%) C#
6 8 (3.86%) JavaScript
7 3 (1.45%) Bash
7 3 (1.45%) Kusto Query Language
7 3 (1.45%) VBA
8 2 (0.97%) PHP
8 2 (0.97%) PowerShell
9 1 (0.48%) PL/SQL
9 1 (0.48%) R
9 1 (0.48%) Search Processing Language
9 1 (0.48%) Shell Script
9 1 (0.48%) T-SQL
Qualifications
1 32 (15.46%) Security Cleared
2 30 (14.49%) Degree
3 29 (14.01%) SC Cleared
4 11 (5.31%) Master's Degree
5 8 (3.86%) CBAP
6 6 (2.90%) CISSP
7 5 (2.42%) Computer Science Degree
7 5 (2.42%) PMI Certification
8 3 (1.45%) CISA
8 3 (1.45%) CompTIA Security+
8 3 (1.45%) DV Cleared
8 3 (1.45%) VCAP
9 2 (0.97%) (ISC)2 CCSP
9 2 (0.97%) Azure Certification
9 2 (0.97%) CEH
9 2 (0.97%) Cisco Certification
9 2 (0.97%) MBA
10 1 (0.48%) AWS Certified Solutions Architect
10 1 (0.48%) Microsoft Certification
10 1 (0.48%) PMP
Quality Assurance & Compliance
1 12 (5.80%) QA
2 11 (5.31%) GDPR
3 7 (3.38%) Data Quality
4 6 (2.90%) ISO/IEC 27001
4 6 (2.90%) NIST
5 4 (1.93%) Accessibility
6 3 (1.45%) GRC
6 3 (1.45%) SOC 2
7 2 (0.97%) Actionable Recommendations
7 2 (0.97%) HIPAA
7 2 (0.97%) PCI DSS
8 1 (0.48%) EU AI Act
8 1 (0.48%) FINRA
8 1 (0.48%) ISO/IEC 27002 (supersedes ISO/IEC 17799)
8 1 (0.48%) ISO/IEC 42001
8 1 (0.48%) PMO
8 1 (0.48%) Sarbanes-Oxley
System Software
1 21 (10.14%) Docker
2 3 (1.45%) VMware NSX
3 2 (0.97%) Active Directory
4 1 (0.48%) Tivoli Workload Scheduler
4 1 (0.48%) zsh
Systems Management
1 30 (14.49%) Kubernetes
2 24 (11.59%) Ansible
3 5 (2.42%) Terraform
4 3 (1.45%) PowerCLI
4 3 (1.45%) SCCM
4 3 (1.45%) vRealize
5 1 (0.48%) Kubeflow
5 1 (0.48%) logstash
5 1 (0.48%) Microsoft Intune
5 1 (0.48%) QRadar
5 1 (0.48%) Rancher
5 1 (0.48%) Single Sign-On
5 1 (0.48%) Tivoli
Vendors
1 24 (11.59%) Microsoft
2 20 (9.66%) Splunk
3 16 (7.73%) SAP
4 9 (4.35%) Google
5 7 (3.38%) Databricks
6 6 (2.90%) Adobe
6 6 (2.90%) OpenLink
7 5 (2.42%) Workday
8 4 (1.93%) OpenAI
8 4 (1.93%) Salesforce
8 4 (1.93%) ServiceNow
9 3 (1.45%) Oracle
9 3 (1.45%) VMware
10 2 (0.97%) Calypso
10 2 (0.97%) Citrix
10 2 (0.97%) IBM
10 2 (0.97%) Informatica
10 2 (0.97%) Murex
10 2 (0.97%) Okta
10 2 (0.97%) Salesforce Marketing Cloud