User Stories Contract Job Trends in London

User Story
England > London

The table below provides summary statistics and contractor rates for jobs advertised in London requiring User Stories skills. It covers contract job vacancies from the 6 months leading up to 18 November 2025, with comparisons to the same periods in the previous two years.

6 months to
18 Nov 2025
Same period 2024 Same period 2023
Rank 106 158 116
Rank change year-on-year +52 -42 -14
Contract jobs citing User Stories 361 248 452
As % of all contract jobs in London 2.58% 1.60% 2.25%
As % of the Processes & Methodologies category 2.80% 1.79% 2.50%
Number of daily rates quoted 257 149 310
10th Percentile £345 £400 £400
25th Percentile £420 £500 £463
Median daily rate (50th Percentile) £500 £550 £550
Median % change year-on-year -9.09% - -
75th Percentile £638 £638 £625
90th Percentile £727 £688 £700
England median daily rate £500 £530 £525
% change year-on-year -5.66% +0.95% -
Number of hourly rates quoted 3 1 2
10th Percentile - - £52.98
25th Percentile - - £55.19
Median hourly rate £31.49 £33.07 £60.25
Median % change year-on-year -4.78% -45.11% -22.26%
75th Percentile £37.25 - £65.19
90th Percentile £40.70 - £67.33
England median hourly rate £74.26 £33.07 £52.75
% change year-on-year +124.55% -37.31% +0.48%

All Process and Methodology Skills
London

User Stories falls under the Processes and Methodologies category. For comparison with the information above, the following table provides summary statistics for all contract job vacancies requiring process or methodology skills in London.

Contract vacancies with a requirement for process or methodology skills 12,903 13,835 18,054
As % of all contract IT jobs advertised in London 92.34% 89.23% 89.71%
Number of daily rates quoted 8,481 8,908 12,964
10th Percentile £333 £350 £356
25th Percentile £425 £450 £463
Median daily rate (50th Percentile) £538 £550 £570
Median % change year-on-year -2.27% -3.51% -3.39%
75th Percentile £656 £675 £688
90th Percentile £775 £800 £800
England median daily rate £505 £525 £545
% change year-on-year -3.81% -3.67% -0.91%
Number of hourly rates quoted 263 165 248
10th Percentile £18.03 £17.35 £18.55
25th Percentile £24.77 £23.80 £21.50
Median hourly rate £29.00 £37.50 £36.33
Median % change year-on-year -22.67% +3.21% -3.11%
75th Percentile £47.25 £55.75 £62.25
90th Percentile £67.00 £80.45 £76.63
England median hourly rate £25.15 £37.50 £45.00
% change year-on-year -32.93% -16.67% +28.57%

User Stories
Job Vacancy Trend in London

Historical trend showing the proportion of contract IT job postings citing User Stories relative to all contract IT jobs advertised in London.
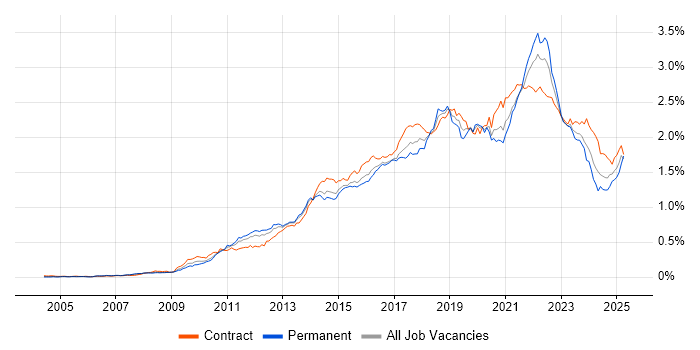
User Stories job vacancy trend in London

User Stories
Daily Rate Trend in London

Contractor daily rate distribution trend for jobs in London citing User Stories.

Contractor daily rate distribution trend for jobs in London citing User Stories

User Stories
Daily Rate Histogram in London

Daily rate distribution for jobs citing User Stories in London over the 6 months to 18 November 2025.

Daily rate histogram for User Stories in London

User Stories
Hourly Rate Trend in London

Contractor hourly rate distribution trend for jobs in London citing User Stories.

Contractor hourly rate distribution trend for jobs in London citing User Stories

User Stories
Contract Job Locations in London

The table below looks at the demand and provides a guide to the median contractor rates quoted in IT jobs citing User Stories within the London region over the 6 months to 18 November 2025. The 'Rank Change' column provides an indication of the change in demand within each location based on the same 6 month period last year.

Location Rank Change
on Same Period
Last Year
Matching
Contract
IT Job Ads
Median
Daily Rate
Past 6 Months
Median Daily Rate
% Change
on Same Period
Last Year
Live
Jobs
Central London +24 74 £500 -21.88% 78
West London - 3 £250 - 26
User Stories
England

User Stories
Co-Occurring Skills & Capabilities in London by Category

The following tables expand on the one above by listing co-occurrences grouped by category. They cover the same employment type, locality and period, with up to 20 co-occurrences shown in each category:

Application Platforms
1 61 (16.90%) Confluence
2 9 (2.49%) CMS
3 5 (1.39%) Apache Airflow
3 5 (1.39%) SharePoint
3 5 (1.39%) WordPress
4 4 (1.11%) Drupal
4 4 (1.11%) JBoss
4 4 (1.11%) Oracle Workflow
5 2 (0.55%) nginx
5 2 (0.55%) Traefik
6 1 (0.28%) Anypoint
6 1 (0.28%) Appian
6 1 (0.28%) Kentico
6 1 (0.28%) SAS
Applications
1 17 (4.71%) MS Visio
2 14 (3.88%) Microsoft Excel
3 13 (3.60%) Microsoft PowerPoint
4 6 (1.66%) Microsoft Office
5 4 (1.11%) Microsoft Project
6 3 (0.83%) Adobe XD
6 3 (0.83%) Sketch
6 3 (0.83%) Trello
7 2 (0.55%) Spreadsheet
8 1 (0.28%) InVision
8 1 (0.28%) Notion
Business Applications
1 13 (3.60%) Dynamics CRM
2 8 (2.22%) Temenos T24
3 4 (1.11%) Endur
3 4 (1.11%) Salesforce CRM
3 4 (1.11%) SAP S/4HANA
4 3 (0.83%) ProductWriter
5 2 (0.55%) HFM
5 2 (0.55%) Payment Gateway
5 2 (0.55%) Shopify
6 1 (0.28%) Dynamics AX
6 1 (0.28%) Infor M3
6 1 (0.28%) OpenLink RightAngle
6 1 (0.28%) Sparx Enterprise Architect
6 1 (0.28%) Summit
6 1 (0.28%) Workday HCM
Cloud Services
1 49 (13.57%) Azure
2 30 (8.31%) AWS
3 28 (7.76%) Azure DevOps
4 22 (6.09%) Power Platform
5 20 (5.54%) GCP
6 14 (3.88%) Miro
7 13 (3.60%) Snowflake
8 12 (3.32%) Dynamics 365
9 11 (3.05%) Figma
10 9 (2.49%) SaaS
11 8 (2.22%) GitHub
11 8 (2.22%) Serverless
12 7 (1.94%) AWS Lambda
12 7 (1.94%) dbt
12 7 (1.94%) GitHub Actions
12 7 (1.94%) Microsoft 365
12 7 (1.94%) PowerApps
12 7 (1.94%) Salesforce Sales Cloud
13 6 (1.66%) Power Automate
13 6 (1.66%) Salesforce Service Cloud
Communications & Networking
1 2 (0.55%) DNS
1 2 (0.55%) Firewall
1 2 (0.55%) HTTP
1 2 (0.55%) VPN
2 1 (0.28%) Calico
2 1 (0.28%) Cisco IPT
2 1 (0.28%) Internet
2 1 (0.28%) LAN
2 1 (0.28%) SD-WAN
2 1 (0.28%) WAN
Database & Business Intelligence
1 20 (5.54%) Power BI
2 18 (4.99%) Data Warehouse
3 16 (4.43%) Tableau
4 12 (3.32%) BigQuery
5 9 (2.49%) Star Schema
6 8 (2.22%) PostgreSQL
7 7 (1.94%) Oracle Database
8 6 (1.66%) Amazon Athena
8 6 (1.66%) Metadata
9 5 (1.39%) Data Vault
9 5 (1.39%) Relational Database
10 4 (1.11%) Snowflake Schema
11 3 (0.83%) SQL Server
11 3 (0.83%) Tableau Desktop
12 2 (0.55%) MongoDB
12 2 (0.55%) Tableau Server
13 1 (0.28%) Amazon RDS
13 1 (0.28%) Elasticsearch
13 1 (0.28%) NoSQL
13 1 (0.28%) Redis
Development Applications
1 99 (27.42%) JIRA
2 11 (3.05%) Jenkins
3 8 (2.22%) Git
3 8 (2.22%) Postman
4 7 (1.94%) Cucumber
5 6 (1.66%) GitLab
5 6 (1.66%) Selenium
6 4 (1.11%) ER Studio
6 4 (1.11%) ERwin
6 4 (1.11%) JUnit
6 4 (1.11%) MLflow
6 4 (1.11%) PowerDesigner
6 4 (1.11%) Zephyr
7 2 (0.55%) Artifactory
7 2 (0.55%) Gatling
7 2 (0.55%) LoadRunner
7 2 (0.55%) Maven
7 2 (0.55%) REST Assured
7 2 (0.55%) SonarQube
7 2 (0.55%) TeamCity
General
1 153 (42.38%) Social Skills
2 102 (28.25%) Finance
3 71 (19.67%) Analytical Skills
4 32 (8.86%) Banking
5 29 (8.03%) Public Sector
6 23 (6.37%) Marketing
7 21 (5.82%) Presentation Skills
8 18 (4.99%) Back Office
8 18 (4.99%) Documentation Skills
8 18 (4.99%) Retail
9 17 (4.71%) Front Office
10 14 (3.88%) Influencing Skills
10 14 (3.88%) Investment Banking
11 8 (2.22%) Organisational Skills
12 6 (1.66%) Billing
12 6 (1.66%) Financial Institution
12 6 (1.66%) Law
12 6 (1.66%) Legal
12 6 (1.66%) Manufacturing
13 5 (1.39%) Advertising
Job Titles
1 192 (53.19%) Analyst
2 180 (49.86%) Business Analyst
3 51 (14.13%) Product Owner
4 44 (12.19%) Senior
5 30 (8.31%) Technical Analyst
6 29 (8.03%) Technical Business Analyst
7 21 (5.82%) Senior Analyst
8 20 (5.54%) Product Manager
9 19 (5.26%) Senior Business Analyst
10 15 (4.16%) Lead
11 11 (3.05%) Product Analyst
11 11 (3.05%) SC Cleared Business Analyst
11 11 (3.05%) Test Analyst
12 10 (2.77%) Consultant
13 9 (2.49%) Agile Business Analyst
13 9 (2.49%) Business Systems Analyst
13 9 (2.49%) Data Business Analyst
13 9 (2.49%) Developer
14 8 (2.22%) Data Analyst
14 8 (2.22%) Insurance Business Analyst
Libraries, Frameworks & Software Standards
1 11 (3.05%) XML
2 9 (2.49%) RESTful
3 8 (2.22%) ADO
4 7 (1.94%) Apache NiFi
4 7 (1.94%) Gherkin
5 6 (1.66%) SOAP
6 5 (1.39%) REST
7 4 (1.11%) HTML
7 4 (1.11%) JSON
7 4 (1.11%) Playwright
7 4 (1.11%) React
7 4 (1.11%) Swagger
8 3 (0.83%) AngularJS
8 3 (0.83%) Node.js
8 3 (0.83%) Pandas
9 2 (0.55%) Akka
9 2 (0.55%) Flask
9 2 (0.55%) Kafka
9 2 (0.55%) OAuth
9 2 (0.55%) OAuth2
Miscellaneous
1 109 (30.19%) Product Ownership
2 16 (4.43%) Reinsurance
3 14 (3.88%) Data Structures
4 13 (3.60%) Greenfield Project
5 12 (3.32%) Cloud Native
6 11 (3.05%) Onboarding
7 10 (2.77%) SWIFT Messaging Network
8 9 (2.49%) PMI
9 8 (2.22%) Algorithms
10 7 (1.94%) Derivative
10 7 (1.94%) Legacy Systems
11 6 (1.66%) Analytical Mindset
11 6 (1.66%) Marketing Technology
12 5 (1.39%) Data Protection Act
12 5 (1.39%) Management Information System
13 4 (1.11%) Digital Media
13 4 (1.11%) Fixed Income
13 4 (1.11%) Foreign Exchange (FX)
13 4 (1.11%) Mobile App
13 4 (1.11%) SCADA
Operating Systems
1 8 (2.22%) Windows
2 7 (1.94%) Linux
3 4 (1.11%) VMS
Processes & Methodologies
1 273 (75.62%) Agile
2 104 (28.81%) Stakeholder Management
3 98 (27.15%) Scrum
4 94 (26.04%) Acceptance Criteria
5 81 (22.44%) Requirements Gathering
6 71 (19.67%) Problem-Solving
7 67 (18.56%) Business Analysis
7 67 (18.56%) Roadmaps
8 66 (18.28%) User Acceptance Testing
9 65 (18.01%) Backlog Management
9 65 (18.01%) Workshop Facilitation
10 59 (16.34%) Data Modelling
10 59 (16.34%) Product Backlog
11 57 (15.79%) DevOps
12 53 (14.68%) Analytics
12 53 (14.68%) Use Case
13 48 (13.30%) Stakeholder Engagement
14 42 (11.63%) Sprint Planning
15 40 (11.08%) Epics
15 40 (11.08%) Product Roadmap
Programming Languages
1 49 (13.57%) SQL
2 23 (6.37%) Python
3 18 (4.99%) Java
4 6 (1.66%) JavaScript
5 4 (1.11%) C#
5 4 (1.11%) Go
5 4 (1.11%) Korn
5 4 (1.11%) VBA
6 3 (0.83%) PowerShell
7 2 (0.55%) Apex Code
7 2 (0.55%) Ruby
7 2 (0.55%) Scala
8 1 (0.28%) Bash
8 1 (0.28%) Groovy
8 1 (0.28%) PHP
8 1 (0.28%) SOQL
8 1 (0.28%) TypeScript
8 1 (0.28%) XPath
Qualifications
1 47 (13.02%) Degree
2 42 (11.63%) Security Cleared
3 40 (11.08%) SC Cleared
4 12 (3.32%) PMI Certification
5 8 (2.22%) CBAP
5 8 (2.22%) CSPO
6 7 (1.94%) Computer Science Degree
7 6 (1.66%) DV Cleared
8 5 (1.39%) CFA
9 4 (1.11%) BPSS Clearance
9 4 (1.11%) PMP
10 3 (0.83%) AWS Certification
10 3 (0.83%) ISTQB
10 3 (0.83%) Six Sigma Black Belt
10 3 (0.83%) Six Sigma Green Belt
11 2 (0.55%) Azure Certification
11 2 (0.55%) Microsoft Certification
12 1 (0.28%) Cisco Certification
12 1 (0.28%) DBS Check
12 1 (0.28%) Master's Degree
Quality Assurance & Compliance
1 55 (15.24%) QA
2 13 (3.60%) Accessibility
3 12 (3.32%) Data Quality
4 11 (3.05%) GDPR
5 6 (1.66%) WCAG
6 5 (1.39%) PSD2
6 5 (1.39%) SEPA
7 3 (0.83%) ISO 20022
8 2 (0.55%) EMIR
8 2 (0.55%) ISO 8583
8 2 (0.55%) MiFID
8 2 (0.55%) PCI DSS
8 2 (0.55%) SLA
9 1 (0.28%) Basel III
9 1 (0.28%) COBIT
9 1 (0.28%) FATCA
9 1 (0.28%) PERC
9 1 (0.28%) PMO
9 1 (0.28%) Software Quality Assurance
System Software
1 11 (3.05%) Docker
2 2 (0.55%) VMware Infrastructure
3 1 (0.28%) Active Directory
3 1 (0.28%) etcd
3 1 (0.28%) Hyper-V
Systems Management
1 9 (2.49%) Kubernetes
2 7 (1.94%) Terraform
3 4 (1.11%) Kubeflow
4 3 (0.83%) Ansible
4 3 (0.83%) Grafana
4 3 (0.83%) Single Sign-On
5 2 (0.55%) Istio
6 1 (0.28%) Argo
6 1 (0.28%) CloudHub
6 1 (0.28%) Microsoft Intune
6 1 (0.28%) NetBackup
6 1 (0.28%) Puppet
Vendors
1 46 (12.74%) Microsoft
2 36 (9.97%) Salesforce
3 20 (5.54%) Oracle
4 11 (3.05%) SAP
5 10 (2.77%) ServiceNow
6 8 (2.22%) Temenos
7 7 (1.94%) Adobe
7 7 (1.94%) Databricks
8 5 (1.39%) Workday
9 4 (1.11%) Atlassian
9 4 (1.11%) Charles River
9 4 (1.11%) Guidewire
9 4 (1.11%) Murex
10 3 (0.83%) Citrix
10 3 (0.83%) HubSpot
10 3 (0.83%) OneTrust
10 3 (0.83%) OpenLink
11 2 (0.55%) FIS
11 2 (0.55%) Tagetik
11 2 (0.55%) UiPath