Use Case Contract Job Trends in London

Use Cases
England > London

The table below provides summary statistics and contractor rates for jobs advertised in London requiring Use Case skills. It covers contract job vacancies from the 6 months leading up to 11 November 2025, with comparisons to the same periods in the previous two years.

6 months to
11 Nov 2025
Same period 2024 Same period 2023
Rank 118 153 209
Rank change year-on-year +35 +56 -35
Contract jobs citing Use Case 334 261 239
As % of all contract jobs in London 2.41% 1.69% 1.18%
As % of the Processes & Methodologies category 2.61% 1.90% 1.31%
Number of daily rates quoted 219 171 150
10th Percentile £395 £400 £406
25th Percentile £466 £473 £477
Median daily rate (50th Percentile) £553 £560 £550
Median % change year-on-year -1.25% +1.82% -8.33%
75th Percentile £675 £650 £675
90th Percentile £775 £775 £819
England median daily rate £525 £550 £550
% change year-on-year -4.55% - -3.51%
Number of hourly rates quoted 2 2 1
10th Percentile £34.43 £66.53 -
25th Percentile £37.31 £66.94 £91.25
Median hourly rate £45.75 £68.75 £92.50
Median % change year-on-year -33.45% -25.68% +55.46%
75th Percentile £55.31 £70.44 £93.75
90th Percentile £58.88 £70.78 -
England median hourly rate £56.90 £62.50 £67.56
% change year-on-year -8.96% -7.49% +13.55%

All Process and Methodology Skills
London

Use Case falls under the Processes and Methodologies category. For comparison with the information above, the following table provides summary statistics for all contract job vacancies requiring process or methodology skills in London.

Contract vacancies with a requirement for process or methodology skills 12,811 13,740 18,222
As % of all contract IT jobs advertised in London 92.42% 89.13% 89.69%
Number of daily rates quoted 8,441 8,850 13,111
10th Percentile £331 £350 £356
25th Percentile £425 £450 £463
Median daily rate (50th Percentile) £540 £550 £575
Median % change year-on-year -1.82% -4.35% -2.13%
75th Percentile £663 £675 £688
90th Percentile £775 £800 £800
England median daily rate £508 £525 £550
% change year-on-year -3.33% -4.55% -
Number of hourly rates quoted 257 161 250
10th Percentile £17.98 £17.25 £18.56
25th Percentile £25.00 £25.00 £21.50
Median hourly rate £29.50 £38.07 £37.17
Median % change year-on-year -22.51% +2.42% -0.88%
75th Percentile £47.00 £56.00 £60.00
90th Percentile £65.00 £80.75 £77.50
England median hourly rate £25.15 £36.17 £44.50
% change year-on-year -30.46% -18.73% +27.14%

Use Case
Job Vacancy Trend in London

Historical trend showing the proportion of contract IT job postings citing Use Case relative to all contract IT jobs advertised in London.
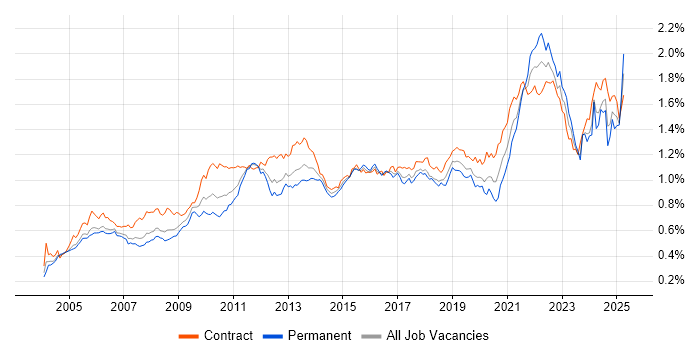
Use Case job vacancy trend in London

Use Case
Daily Rate Trend in London

Contractor daily rate distribution trend for jobs in London citing Use Case.

Contractor daily rate distribution trend for jobs in London citing Use Case

Use Case
Daily Rate Histogram in London

Daily rate distribution for jobs citing Use Case in London over the 6 months to 11 November 2025.

Daily rate histogram for Use Case in London

Use Case
Hourly Rate Trend in London

Contractor hourly rate distribution trend for jobs in London citing Use Case.

Contractor hourly rate distribution trend for jobs in London citing Use Case

Use Case
Hourly Rate Histogram in London

Hourly rate distribution of jobs citing Use Case in London over the 6 months to 11 November 2025.

Hourly rate histogram for Use Case in London

Use Case
Contract Job Locations in London

The table below looks at the demand and provides a guide to the median contractor rates quoted in IT jobs citing Use Case within the London region over the 6 months to 11 November 2025. The 'Rank Change' column provides an indication of the change in demand within each location based on the same 6 month period last year.

Location Rank Change
on Same Period
Last Year
Matching
Contract
IT Job Ads
Median
Daily Rate
Past 6 Months
Median Daily Rate
% Change
on Same Period
Last Year
Live
Jobs
Central London -11 37 £575 +4.55% 124
South London -4 4 £475 -17.39% 9
East London -7 1 - - 9
Use Case
England

Use Case
Co-Occurring Skills & Capabilities in London by Category

The following tables expand on the one above by listing co-occurrences grouped by category. They cover the same employment type, locality and period, with up to 20 co-occurrences shown in each category:

Application Platforms
1 18 (5.39%) Confluence
2 14 (4.19%) Apache Airflow
3 12 (3.59%) SharePoint
4 8 (2.40%) Apache Spark
5 3 (0.90%) Apache
5 3 (0.90%) Appian
6 2 (0.60%) Ethereum
6 2 (0.60%) Hyperledger
6 2 (0.60%) Jupyter
6 2 (0.60%) Luigi
7 1 (0.30%) CMS
7 1 (0.30%) Microsoft Exchange
Applications
1 13 (3.89%) Microsoft Excel
2 11 (3.29%) MS Visio
3 9 (2.69%) Microsoft PowerPoint
4 5 (1.50%) ProjectWise
5 4 (1.20%) Microsoft Project
6 1 (0.30%) Adobe After Effects
6 1 (0.30%) Adobe Illustrator
6 1 (0.30%) Adobe Premiere
6 1 (0.30%) Chatbot
6 1 (0.30%) Microsoft Office
6 1 (0.30%) Photoshop
Business Applications
1 6 (1.80%) SAP S/4HANA
2 5 (1.50%) Teamcenter
3 4 (1.20%) Endur
4 3 (0.90%) SAP PS
5 2 (0.60%) Payment Gateway
5 2 (0.60%) SAP MDG
5 2 (0.60%) Sparx Enterprise Architect
6 1 (0.30%) Dynamics CRM
6 1 (0.30%) Findur
6 1 (0.30%) Orchestrade
6 1 (0.30%) PORTIA
6 1 (0.30%) Salesforce CRM
6 1 (0.30%) Shopify
Cloud Services
1 104 (31.14%) Azure
2 84 (25.15%) AWS
3 37 (11.08%) GCP
4 27 (8.08%) SaaS
5 24 (7.19%) Azure DevOps
5 24 (7.19%) Power Platform
6 22 (6.59%) Amazon S3
7 20 (5.99%) Amazon EC2
8 19 (5.69%) Amazon SQS
9 18 (5.39%) Snowflake
10 12 (3.59%) GitHub
11 10 (2.99%) GitHub Actions
11 10 (2.99%) Vertex AI
12 9 (2.69%) dbt
13 8 (2.40%) Azure Data Factory
13 8 (2.40%) Entra ID
13 8 (2.40%) Microsoft 365
13 8 (2.40%) Microsoft Copilot
14 7 (2.10%) Azure AI
14 7 (2.10%) Azure Monitor
Communications & Networking
1 7 (2.10%) Firewall
2 5 (1.50%) CTI
2 5 (1.50%) VoIP
3 3 (0.90%) SSH
3 3 (0.90%) Structured Cabling
4 1 (0.30%) HTTP
4 1 (0.30%) Internet
4 1 (0.30%) NAS
4 1 (0.30%) Network Security
4 1 (0.30%) Radio Access Network
4 1 (0.30%) S/MIME
4 1 (0.30%) SSL
Database & Business Intelligence
1 18 (5.39%) Metadata
2 17 (5.09%) Data Lake
2 17 (5.09%) Power BI
3 15 (4.49%) SQL Server
4 13 (3.89%) Data Warehouse
5 12 (3.59%) PostgreSQL
5 12 (3.59%) Tableau
6 9 (2.69%) Delta Lake
7 8 (2.40%) Data Vault
7 8 (2.40%) Snowflake Schema
8 7 (2.10%) BigQuery
8 7 (2.10%) SQL Server Integration Services
8 7 (2.10%) Star Schema
9 6 (1.80%) Big Data
10 5 (1.50%) Hadoop
11 4 (1.20%) Pinecone
12 3 (0.90%) Apache Hive
12 3 (0.90%) Oracle ODI
12 3 (0.90%) Redis
12 3 (0.90%) Spark SQL
Development Applications
1 30 (8.98%) JIRA
2 23 (6.89%) Git
3 11 (3.29%) MLflow
4 7 (2.10%) Cucumber
4 7 (2.10%) ERwin
4 7 (2.10%) PowerDesigner
4 7 (2.10%) Selenium
5 5 (1.50%) JUnit
6 4 (1.20%) Bitbucket
6 4 (1.20%) ER Studio
6 4 (1.20%) Postman
6 4 (1.20%) SonarQube
7 3 (0.90%) GitLab
7 3 (0.90%) Oracle APEX
7 3 (0.90%) Robot Framework
8 2 (0.60%) Hardhat
9 1 (0.30%) Balsamiq
9 1 (0.30%) Gatling
9 1 (0.30%) LoadRunner
9 1 (0.30%) Visual Studio
General
1 117 (35.03%) Social Skills
2 97 (29.04%) Finance
3 81 (24.25%) Analytical Skills
4 41 (12.28%) Banking
5 31 (9.28%) Public Sector
6 28 (8.38%) Documentation Skills
7 18 (5.39%) Back Office
8 17 (5.09%) Investment Banking
9 16 (4.79%) Marketing
10 12 (3.59%) Front Office
11 11 (3.29%) Presentation Skills
11 11 (3.29%) Retail
12 10 (2.99%) Inclusion and Diversity
12 10 (2.99%) Legal
13 9 (2.69%) Organisational Skills
14 5 (1.50%) Aerospace
14 5 (1.50%) Telecoms
15 4 (1.20%) Advertising
15 4 (1.20%) Manufacturing
15 4 (1.20%) Military
Job Titles
1 69 (20.66%) Analyst
2 52 (15.57%) Business Analyst
3 51 (15.27%) Architect
4 38 (11.38%) Developer
4 38 (11.38%) Senior
5 23 (6.89%) Security Architect
6 21 (6.29%) Consultant
7 20 (5.99%) Lead
8 17 (5.09%) Artificial Intelligence Engineer
9 14 (4.19%) Data Analyst
9 14 (4.19%) Product Manager
10 13 (3.89%) Senior Analyst
11 12 (3.59%) Data Engineer
11 12 (3.59%) Senior Business Analyst
12 11 (3.29%) Security Engineer
13 10 (2.99%) Data Architect
14 8 (2.40%) Data Modeller
14 8 (2.40%) Data Scientist
14 8 (2.40%) Software Engineer
15 7 (2.10%) Risk Analyst
Libraries, Frameworks & Software Standards
1 12 (3.59%) LangChain
2 11 (3.29%) .NET
3 10 (2.99%) PyTorch
4 9 (2.69%) PySpark
5 7 (2.10%) REST
5 7 (2.10%) XML
6 6 (1.80%) CSS
6 6 (1.80%) HTML
6 6 (1.80%) Node.js
6 6 (1.80%) Pandas
6 6 (1.80%) React
7 5 (1.50%) Android NDK
7 5 (1.50%) Android SDK
7 5 (1.50%) FastAPI
7 5 (1.50%) iOS SDK
7 5 (1.50%) JNI
7 5 (1.50%) JSON
7 5 (1.50%) LangGraph
7 5 (1.50%) MIDP
7 5 (1.50%) TensorFlow
Miscellaneous
1 51 (15.27%) Onboarding
2 28 (8.38%) Product Ownership
3 23 (6.89%) Security Operations Centre
4 20 (5.99%) AI Agents
4 20 (5.99%) CSOC
5 16 (4.79%) Greenfield Project
6 12 (3.59%) Cloud Native
6 12 (3.59%) Linux Command Line
6 12 (3.59%) Management Information System
7 10 (2.99%) Algorithms
7 10 (2.99%) Data Structures
8 8 (2.40%) Data Centre
9 7 (2.10%) PMI
9 7 (2.10%) Security Posture
10 6 (1.80%) Distributed Computing
11 5 (1.50%) Blockchain
11 5 (1.50%) Marketing Technology
11 5 (1.50%) Operational Technology
11 5 (1.50%) Virtual Reality
11 5 (1.50%) Virtual Team
Operating Systems
1 23 (6.89%) Linux
2 17 (5.09%) Windows
3 5 (1.50%) Android
3 5 (1.50%) Apple iOS
3 5 (1.50%) Mac OS
4 3 (0.90%) Unix
5 1 (0.30%) Red Hat Enterprise Linux
Processes & Methodologies
1 92 (27.54%) AI
2 89 (26.65%) Agile
3 82 (24.55%) Analytics
4 70 (20.96%) Problem-Solving
5 64 (19.16%) Stakeholder Engagement
6 62 (18.56%) Machine Learning
7 59 (17.66%) Data Modelling
8 56 (16.77%) Stakeholder Management
9 52 (15.57%) User Stories
10 51 (15.27%) CI/CD
10 51 (15.27%) Cybersecurity
11 43 (12.87%) Data Governance
11 43 (12.87%) Requirements Gathering
11 43 (12.87%) Roadmaps
12 41 (12.28%) DevOps
13 40 (11.98%) LLM
13 40 (11.98%) SIEM
14 37 (11.08%) Business Analysis
14 37 (11.08%) Data Science
15 33 (9.88%) Data Pipeline
Programming Languages
1 83 (24.85%) Python
2 67 (20.06%) SQL
3 24 (7.19%) Java
4 19 (5.69%) Bash
5 14 (4.19%) JavaScript
6 9 (2.69%) C#
6 9 (2.69%) Kusto Query Language
7 7 (2.10%) TypeScript
8 6 (1.80%) C++
8 6 (1.80%) PowerShell
9 4 (1.20%) Kotlin
9 4 (1.20%) VB.NET
10 3 (0.90%) PL/SQL
10 3 (0.90%) R
11 2 (0.60%) Korn
11 2 (0.60%) Search Processing Language
11 2 (0.60%) Solidity
11 2 (0.60%) SPARQL
11 2 (0.60%) T-SQL
12 1 (0.30%) Bicep
Qualifications
1 61 (18.26%) Degree
2 48 (14.37%) Security Cleared
3 38 (11.38%) SC Cleared
4 19 (5.69%) Computer Science Degree
5 15 (4.49%) Master's Degree
6 11 (3.29%) PMI Certification
7 8 (2.40%) CBAP
7 8 (2.40%) CISSP
8 7 (2.10%) MCP
9 6 (1.80%) DV Cleared
10 5 (1.50%) CFA
11 4 (1.20%) (ISC)2 CCSP
11 4 (1.20%) BPSS Clearance
11 4 (1.20%) Cisco Certification
11 4 (1.20%) CompTIA Security+
11 4 (1.20%) PMP
12 3 (0.90%) AWS Certification
12 3 (0.90%) Azure Certification
12 3 (0.90%) PhD
13 2 (0.60%) ISEB
Quality Assurance & Compliance
1 38 (11.38%) Data Quality
2 24 (7.19%) QA
3 14 (4.19%) GDPR
4 10 (2.99%) NIST
5 9 (2.69%) Accessibility
6 8 (2.40%) EU AI Act
6 8 (2.40%) ISO/IEC 27001
7 6 (1.80%) ISO 19650
8 4 (1.20%) PCI DSS
8 4 (1.20%) PSD2
9 3 (0.90%) ISO 20022
9 3 (0.90%) PMO
10 2 (0.60%) FINRA
10 2 (0.60%) GRC
10 2 (0.60%) HIPAA
10 2 (0.60%) HL7
10 2 (0.60%) ISO 8583
10 2 (0.60%) SEPA
10 2 (0.60%) SOC 2
10 2 (0.60%) WCAG
System Software
1 19 (5.69%) Docker
2 11 (3.29%) Active Directory
3 10 (2.99%) zsh
4 5 (1.50%) Virtual Desktop
5 2 (0.60%) Virtual Machines
Systems Management
1 16 (4.79%) Kubernetes
2 11 (3.29%) Terraform
3 5 (1.50%) Ansible
3 5 (1.50%) Grafana
4 4 (1.20%) Kubeflow
5 3 (0.90%) Prometheus
5 3 (0.90%) Single Sign-On
6 1 (0.30%) Argo
6 1 (0.30%) HP ALM
6 1 (0.30%) Kibana
6 1 (0.30%) Microsoft Intune
6 1 (0.30%) QRadar
Vendors
1 47 (14.07%) Microsoft
2 33 (9.88%) Splunk
3 24 (7.19%) Databricks
4 12 (3.59%) OpenAI
5 10 (2.99%) Salesforce
5 10 (2.99%) SAP
6 9 (2.69%) Oracle
7 8 (2.40%) Citrix
7 8 (2.40%) Google
7 8 (2.40%) ServiceNow
8 6 (1.80%) CyberArk
8 6 (1.80%) Genesys
9 5 (1.50%) Adobe
9 5 (1.50%) UiPath
10 4 (1.20%) CrowdStrike
10 4 (1.20%) Palantir
10 4 (1.20%) Tenable
11 3 (0.90%) Cisco
11 3 (0.90%) Foundry
11 3 (0.90%) HubSpot