OCI Contracts

Oracle Cloud Infrastructure (Oracle OCI, Oracle Cloud)
UK

The table below provides summary statistics for contract job vacancies requiring OCI skills. It includes a benchmarking guide to the contractor rates offered in vacancies that cited OCI over the 6 months leading up to 29 May 2025, comparing them to the same period in the previous two years.

6 months to
29 May 2025
Same period 2024 Same period 2023
Rank 283 302 403
Rank change year-on-year +19 +101 +18
Contract jobs citing OCI 260 308 304
As % of all contract jobs advertised in the UK 0.90% 0.72% 0.54%
As % of the Cloud Services category 2.40% 2.21% 1.48%
Number of daily rates quoted 153 184 128
10th Percentile £415 £400 £454
25th Percentile £500 £463 £513
Median daily rate (50th Percentile) £550 £535 £600
Median % change year-on-year +2.80% -10.83% +4.35%
75th Percentile £638 £608 £700
90th Percentile £725 £738 £800
UK excluding London median daily rate £550 £550 £600
% change year-on-year - -8.33% +12.94%
Number of hourly rates quoted 0 1 0
Median hourly rate - £28.00 -
UK excluding London median hourly rate - £28.00 -

All Cloud Skills
UK

OCI falls under the Cloud Services category. For comparison with the information above, the following table provides summary statistics for all contract job vacancies requiring cloud computing skills.

Contract vacancies with a requirement for cloud computing skills 10,848 13,932 20,504
As % of all contract IT jobs advertised in the UK 37.65% 32.53% 36.44%
Number of daily rates quoted 7,406 9,914 14,827
10th Percentile £313 £300 £325
25th Percentile £413 £413 £450
Median daily rate (50th Percentile) £508 £525 £550
Median % change year-on-year -3.33% -4.55% -
75th Percentile £619 £635 £650
90th Percentile £725 £738 £748
UK excluding London median daily rate £475 £488 £500
% change year-on-year -2.56% -2.50% -
Number of hourly rates quoted 248 345 328
10th Percentile £15.09 £14.00 £15.25
25th Percentile £18.13 £16.06 £18.50
Median hourly rate £27.88 £21.37 £36.50
Median % change year-on-year +30.46% -41.45% +64.41%
75th Percentile £46.51 £40.00 £67.81
90th Percentile £71.63 £68.05 £79.19
UK excluding London median hourly rate £19.62 £17.72 £26.48
% change year-on-year +10.72% -33.08% +34.93%

OCI
Job Vacancy Trend

Job postings citing OCI as a proportion of all IT jobs advertised.
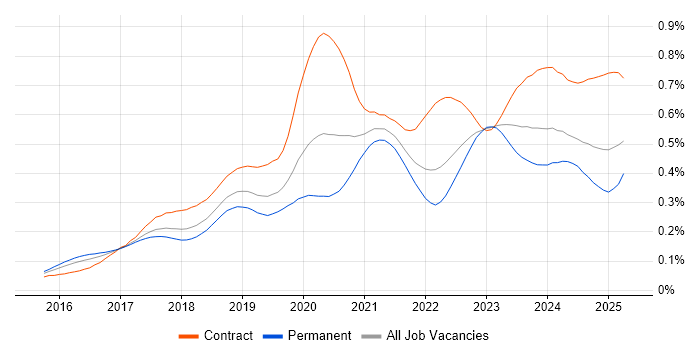
Job vacancy trend for OCI in the UK

OCI
Contractor Daily Rate Trend

3-month moving average daily rate quoted in jobs citing OCI.

Daily rate trend for OCI in the UK

OCI
Daily Rate Histogram

Daily rate distribution for jobs citing OCI over the 6 months to 29 May 2025.

Daily rate histogram for OCI in the UK

OCI
Contractor Hourly Rate Trend

3-month moving average hourly rates quoted in jobs citing OCI.

Hourly rate trend for OCI in the UK

OCI
Top 15 Contract Locations

The table below looks at the demand and provides a guide to the median contractor rates quoted in IT jobs citing OCI within the UK over the 6 months to 29 May 2025. The 'Rank Change' column provides an indication of the change in demand within each location based on the same 6 month period last year.

Location Rank Change
on Same Period
Last Year
Matching
Contract
IT Job Ads
Median
Daily Rate
Past 6 Months
Median Daily Rate
% Change
on Same Period
Last Year
Live
Jobs
England +48 196 £600 +9.09% 1,963
UK excluding London +45 119 £550 - 2,018
London +43 99 £600 +14.30% 157
Work from Home +10 87 £550 +4.76% 622
South East +59 45 £600 -0.83% 493
Scotland -3 29 £507 -3.52% 88
Midlands +4 12 £600 +41.18% 410
North of England +2 12 £569 +13.75% 455
West Midlands +17 11 £588 -9.62% 218
Yorkshire +15 11 £588 +18.99% 192
South West +34 10 £550 +5.77% 245
Northern Ireland -9 6 £513 -21.15% 32
Wales - 4 £405 - 58
East of England +27 2 £530 -29.33% 316
North West -7 1 £550 +10.00% 207

OCI
Co-occurring Skills and Capabilities by Category

The follow tables expand on the table above by listing co-occurrences grouped by category. The same employment type, locality and period is covered with up to 20 co-occurrences shown in each of the following categories:

Application Platforms
1 21 (8.08%) Oracle SOA Suite
2 12 (4.62%) Oracle Workflow
3 9 (3.46%) WebLogic
4 8 (3.08%) Oracle Service Bus
5 4 (1.54%) CMS
6 3 (1.15%) Adobe Experience Manager
6 3 (1.15%) Confluence
6 3 (1.15%) Documentum
6 3 (1.15%) Oracle Self-Service HR
7 2 (0.77%) Apache
7 2 (0.77%) nginx
8 1 (0.38%) Apache Spark
8 1 (0.38%) IIS
8 1 (0.38%) JBoss
8 1 (0.38%) Oracle UPK
8 1 (0.38%) Tomcat
8 1 (0.38%) WebLogic Portal
8 1 (0.38%) WebSphere
8 1 (0.38%) WebSphere Application Server
Applications
1 15 (5.77%) Oracle Smart View
2 5 (1.92%) Microsoft Excel
3 3 (1.15%) Microsoft Office
3 3 (1.15%) Microsoft PowerPoint
4 1 (0.38%) Microsoft Project
Business Applications
1 39 (15.00%) Oracle EBS
2 28 (10.77%) Oracle ERP
3 26 (10.00%) Oracle Payables
4 19 (7.31%) Oracle Receivables
5 14 (5.38%) Oracle Financials
6 12 (4.62%) Oracle EBS R12
6 12 (4.62%) Oracle General Ledger
7 10 (3.85%) Oracle Cash Management
7 10 (3.85%) Oracle Payroll
8 9 (3.46%) Oracle Procure-to-Pay
9 8 (3.08%) Oracle Assets
10 7 (2.69%) Oracle Applications
11 6 (2.31%) Oracle BPM
12 4 (1.54%) Sage X3
13 3 (1.15%) Oracle iProcurement
14 2 (0.77%) NetSuite
14 2 (0.77%) Oracle Internet Expenses
14 2 (0.77%) Oracle Subledger Accounting
15 1 (0.38%) HFM
15 1 (0.38%) Remedy ITSM
Cloud Services
1 33 (12.69%) SaaS
2 24 (9.23%) Azure
3 16 (6.15%) AWS
4 14 (5.38%) PaaS
5 13 (5.00%) Power Platform
6 9 (3.46%) Cloud Computing
7 7 (2.69%) GitHub
8 6 (2.31%) Oracle CX
9 4 (1.54%) Azure DevOps
9 4 (1.54%) GCP
10 3 (1.15%) AWS CloudFormation
10 3 (1.15%) Snowflake
11 2 (0.77%) Amazon CloudWatch
11 2 (0.77%) AWS CodeCommit
11 2 (0.77%) AWS CodeDeploy
11 2 (0.77%) AWS Lambda
11 2 (0.77%) Azure Service Bus
11 2 (0.77%) Boomi
11 2 (0.77%) dbt
11 2 (0.77%) Serverless
Communications & Networking
1 8 (3.08%) Firewall
2 5 (1.92%) Network Security
3 4 (1.54%) SSL
4 3 (1.15%) VPN
5 2 (0.77%) IPsec
6 1 (0.38%) BGP
6 1 (0.38%) WAN
Database & Business Intelligence
1 68 (26.15%) Oracle Reports
2 42 (16.15%) Oracle BI Publisher
3 20 (7.69%) Oracle Database
4 18 (6.92%) Data Warehouse
4 18 (6.92%) Oracle ODI
5 13 (5.00%) Power BI
5 13 (5.00%) Tableau
6 6 (2.31%) Oracle BI EE
7 5 (1.92%) Qlik Sense
7 5 (1.92%) SQL Server
8 4 (1.54%) Oracle Database 11g
8 4 (1.54%) Oracle Exadata
9 2 (0.77%) Amazon RDS
9 2 (0.77%) Apache Hive
9 2 (0.77%) Big Data
9 2 (0.77%) Essbase
9 2 (0.77%) Impala
9 2 (0.77%) Relational Database
10 1 (0.38%) Data Mining
10 1 (0.38%) MySQL
Development Applications
1 10 (3.85%) Oracle Forms
2 7 (2.69%) JIRA
3 5 (1.92%) Jenkins
4 4 (1.54%) Subversion
5 1 (0.38%) Git
5 1 (0.38%) Hudson
5 1 (0.38%) JUnit
5 1 (0.38%) Mockito
5 1 (0.38%) Oracle APEX
5 1 (0.38%) SpecFlow
General
1 115 (44.23%) Finance
2 67 (25.77%) Social Skills
3 43 (16.54%) Public Sector
4 36 (13.85%) Analytical Skills
5 10 (3.85%) General Ledger
5 10 (3.85%) Presentation Skills
6 6 (2.31%) Banking
6 6 (2.31%) Financial Institution
6 6 (2.31%) Local Government
7 5 (1.92%) Back Office
8 4 (1.54%) Legal
8 4 (1.54%) Manufacturing
8 4 (1.54%) Organisational Skills
9 3 (1.15%) Billing
9 3 (1.15%) Inclusion and Diversity
9 3 (1.15%) Military
10 2 (0.77%) French Language
10 2 (0.77%) Investment Banking
10 2 (0.77%) Pharmaceutical
10 2 (0.77%) Telecoms
Job Titles
1 50 (19.23%) Consultant
2 45 (17.31%) Oracle Consultant
3 25 (9.62%) Architect
3 25 (9.62%) Lead
4 24 (9.23%) Analyst
5 21 (8.08%) Cloud Consultant
6 19 (7.31%) Developer
6 19 (7.31%) Senior
7 15 (5.77%) Oracle Architect
7 15 (5.77%) Oracle Specialist
8 14 (5.38%) Oracle Analyst
8 14 (5.38%) Oracle Developer
9 12 (4.62%) Cloud Architect
10 10 (3.85%) Security Architect
11 9 (3.46%) DBA
11 9 (3.46%) Functional Consultant
11 9 (3.46%) Oracle Functional Consultant
11 9 (3.46%) Oracle Payroll Consultant
11 9 (3.46%) Payroll Consultant
11 9 (3.46%) Report Writer
Libraries, Frameworks & Software Standards
1 98 (37.69%) Oracle Fusion
2 19 (7.31%) REST
3 17 (6.54%) Web Services
4 16 (6.15%) SOAP
5 13 (5.00%) Middleware
5 13 (5.00%) OAuth
6 9 (3.46%) SAML
7 8 (3.08%) OpenID
8 7 (2.69%) XML
9 4 (1.54%) OAuth2
10 3 (1.15%) JSON
10 3 (1.15%) WebCenter
11 2 (0.77%) Django
11 2 (0.77%) MACH
12 1 (0.38%) Ajax
12 1 (0.38%) CSS
12 1 (0.38%) JWT
12 1 (0.38%) Spring
12 1 (0.38%) XSLT
12 1 (0.38%) YAML
Miscellaneous
1 14 (5.38%) Management Information System
2 11 (4.23%) Onboarding
3 7 (2.69%) Security Posture
4 6 (2.31%) Public Cloud
5 5 (1.92%) Legacy Systems
6 4 (1.54%) Clustering
6 4 (1.54%) Replication
7 3 (1.15%) e-Learning
7 3 (1.15%) Product Ownership
7 3 (1.15%) Self-Motivation
8 2 (0.77%) Data Structures
8 2 (0.77%) Team-Oriented Environment
9 1 (0.38%) Cloud Native
9 1 (0.38%) Cyber Threat
9 1 (0.38%) Data Protection Act
9 1 (0.38%) Enterprise Software
9 1 (0.38%) Hedge funds
9 1 (0.38%) Hybrid Cloud
9 1 (0.38%) Security Operations Centre
9 1 (0.38%) SWIFT Messaging Network
Operating Systems
1 19 (7.31%) Linux
2 11 (4.23%) AIX
3 9 (3.46%) Windows
4 7 (2.69%) Oracle Linux
5 5 (1.92%) Unix
6 4 (1.54%) Red Hat Enterprise Linux
6 4 (1.54%) Solaris
Processes & Methodologies
1 95 (36.54%) ERP
2 51 (19.62%) Problem-Solving
3 48 (18.46%) Business Intelligence
3 48 (18.46%) Migration
4 36 (13.85%) Analytics
5 34 (13.08%) Data Modelling
6 32 (12.31%) Data Migration
7 31 (11.92%) Validation
8 27 (10.38%) Agile
9 26 (10.00%) User Acceptance Testing
10 24 (9.23%) DevOps
10 24 (9.23%) Performance Tuning
11 22 (8.46%) Data Visualisation
11 22 (8.46%) Stakeholder Management
11 22 (8.46%) Visualisation
12 21 (8.08%) SOA
13 19 (7.31%) CI/CD
13 19 (7.31%) Project Delivery
14 16 (6.15%) Actionable Insight
14 16 (6.15%) Project Management
Programming Languages
1 61 (23.46%) SQL
2 30 (11.54%) PL/SQL
3 26 (10.00%) Python
4 18 (6.92%) Java
5 7 (2.69%) Shell Script
6 6 (2.31%) ProC
7 4 (1.54%) Perl
8 3 (1.15%) JavaScript
8 3 (1.15%) WebLogic Scripting Tool
9 2 (0.77%) R
10 1 (0.38%) C#
10 1 (0.38%) Groovy
10 1 (0.38%) PowerShell
10 1 (0.38%) Scala
10 1 (0.38%) Search Processing Language
Qualifications
1 65 (25.00%) Security Cleared
2 57 (21.92%) SC Cleared
3 24 (9.23%) Degree
4 14 (5.38%) Computer Science Degree
5 11 (4.23%) Oracle Certification
6 9 (3.46%) OCP
7 4 (1.54%) Azure Certification
8 3 (1.15%) BPSS Clearance
8 3 (1.15%) Cisco Certification
8 3 (1.15%) CISSP
8 3 (1.15%) SANS
9 2 (0.77%) (ISC)2 CCSP
9 2 (0.77%) AWS Certification
9 2 (0.77%) CCSP
9 2 (0.77%) CTC Cleared
9 2 (0.77%) Master's Degree
9 2 (0.77%) OSCP
9 2 (0.77%) PMP
9 2 (0.77%) VMware Certified Professional (VCP)
10 1 (0.38%) CCNP
Quality Assurance & Compliance
1 11 (4.23%) ISO/IEC 27001
2 10 (3.85%) NIST
3 9 (3.46%) Data Quality
4 7 (2.69%) ISO/IEC 27002 (supersedes ISO/IEC 17799)
4 7 (2.69%) Sarbanes-Oxley
5 3 (1.15%) GDPR
6 2 (0.77%) Disclosure Scotland
6 2 (0.77%) QA
7 1 (0.38%) COBIT
7 1 (0.38%) ISO 20022
7 1 (0.38%) ITGC
7 1 (0.38%) NIST 800
7 1 (0.38%) PCI DSS
7 1 (0.38%) PMO
7 1 (0.38%) SLA
System Software
1 14 (5.38%) Docker
2 12 (4.62%) Oracle RAC
3 8 (3.08%) Virtual Machines
4 2 (0.77%) LXC
4 2 (0.77%) VMware Infrastructure
4 2 (0.77%) vSphere
5 1 (0.38%) Active Directory
Systems Management
1 17 (6.54%) Kubernetes
2 11 (4.23%) Ansible
3 10 (3.85%) Data Guard
4 8 (3.08%) Oracle Enterprise Manager
5 6 (2.31%) Terraform
6 5 (1.92%) Oracle RMAN
7 4 (1.54%) Enterprise Manager Cloud Control
7 4 (1.54%) Failover Clustering
7 4 (1.54%) Microsoft Clustering
7 4 (1.54%) Oracle Flashback
8 1 (0.38%) Computer Emergency Response Teams
8 1 (0.38%) Oracle Identity Management
8 1 (0.38%) Oracle Identity Manager
Vendors
1 255 (98.08%) Oracle
2 24 (9.23%) Microsoft
3 5 (1.92%) Commvault
3 5 (1.92%) Red Hat
4 4 (1.54%) Dell
4 4 (1.54%) Dynatrace
4 4 (1.54%) IBM
4 4 (1.54%) Sage
4 4 (1.54%) Siebel
5 3 (1.15%) Adobe
5 3 (1.15%) ServiceNow
5 3 (1.15%) Splunk
6 2 (0.77%) CA Agile Central
6 2 (0.77%) Hyperion
6 2 (0.77%) VMware
7 1 (0.38%) Civica
7 1 (0.38%) JD Edwards
7 1 (0.38%) Rapid7
7 1 (0.38%) Virgin Media
7 1 (0.38%) Workday