Middleware Jobs in London

Middleware
England > London

The following table provides summary statistics for permanent job vacancies advertised in London with a requirement for Middleware skills. Included is a benchmarking guide to the salaries offered in vacancies that have cited Middleware over the 6 months to 11 May 2024 with a comparison to the same period in the previous 2 years.

6 months to
11 May 2024
Same period 2023 Same period 2022
Rank 389 360 431
Rank change year-on-year -29 +71 -83
Permanent jobs citing Middleware 126 303 555
As % of all permanent jobs advertised in London 0.53% 0.88% 0.82%
As % of the Libraries, Frameworks & Software Standards category 2.17% 2.55% 1.79%
Number of salaries quoted 109 179 334
10th Percentile £55,914 £52,500 £47,500
25th Percentile £70,000 £56,860 £55,313
Median annual salary (50th Percentile) £82,500 £70,000 £75,000
Median % change year-on-year +17.86% -6.67% +7.14%
75th Percentile £115,000 £89,864 £100,000
90th Percentile £141,000 £118,000 £122,500
England median annual salary £65,000 £65,000 £65,000
% change year-on-year - - +4.00%

All Software Libraries and Frameworks
London

Middleware is in the Software Libraries and Frameworks category. The following table is for comparison with the above and provides summary statistics for all permanent job vacancies advertised in London with a requirement for technical specification, industry standards, software libraries and framework skills.

Permanent vacancies with a requirement for technical specification, industry standards, software libraries and framework skills 5,817 11,903 31,075
As % of all permanent jobs advertised in London 24.61% 34.74% 46.02%
Number of salaries quoted 4,715 8,390 12,838
10th Percentile £47,500 £50,000 £48,425
25th Percentile £60,000 £62,500 £58,750
Median annual salary (50th Percentile) £80,000 £80,000 £77,000
Median % change year-on-year - +3.90% +10.00%
75th Percentile £102,500 £100,000 £96,250
90th Percentile £130,000 £120,000 £115,000
England median annual salary £60,000 £67,500 £65,000
% change year-on-year -11.11% +3.85% +13.04%

Middleware
Job Vacancy Trend in London

Job postings citing Middleware as a proportion of all IT jobs advertised in London.
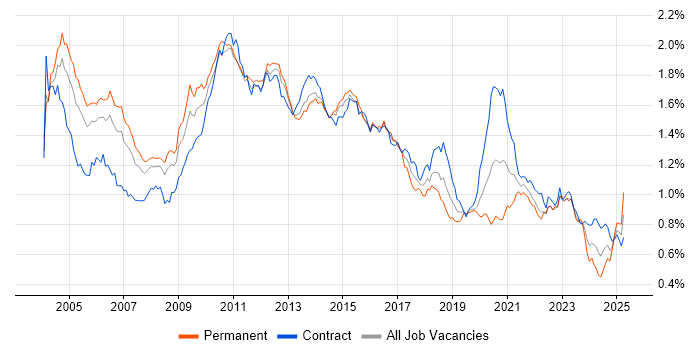
Job vacancy trend for Middleware in London

Middleware
Salary Trend in London

3-month moving average salary quoted in jobs citing Middleware in London.

Salary trend for Middleware in London

Middleware
Salary Histogram in London

Salary distribution for jobs citing Middleware in London over the 6 months to 11 May 2024.

Salary histogram for Middleware in London

Middleware
Job Locations in London

The table below looks at the demand and provides a guide to the median salaries quoted in IT jobs citing Middleware within the London region over the 6 months to 11 May 2024. The 'Rank Change' column provides an indication of the change in demand within each location based on the same 6 month period last year.

Location Rank Change
on Same Period
Last Year
Matching
Permanent
IT Job Ads
Median Salary
Past 6 Months
Median Salary
% Change
on Same Period
Last Year
Live
Jobs
Central London +26 14 £80,000 -27.27% 1
East London +26 14 £57,500 +4.55%
Middleware
England

Middleware
Co-occurring Skills and Capabilities in London by Category

The follow tables expand on the table above by listing co-occurrences grouped by category. The same employment type, locality and period is covered with up to 20 co-occurrences shown in each of the following categories:

Application Platforms
1 3 (2.38%) WebSphere
2 2 (1.59%) Apache
2 2 (1.59%) CMS
2 2 (1.59%) GlassFish
2 2 (1.59%) JCAPS
2 2 (1.59%) WebLogic
2 2 (1.59%) WebSphere Application Server
3 1 (0.79%) Confluence
3 1 (0.79%) Microsoft Exchange
3 1 (0.79%) SharePoint
Applications
1 4 (3.17%) Microsoft Office
2 2 (1.59%) MS Visio
Business Applications
1 2 (1.59%) Adaptiv
1 2 (1.59%) Sparx Enterprise Architect
2 1 (0.79%) Cognos Controller
2 1 (0.79%) IBM Planning Analytics
2 1 (0.79%) Magento
2 1 (0.79%) Oracle FAH
2 1 (0.79%) Oracle General Ledger
2 1 (0.79%) SAP ERP
2 1 (0.79%) SAP S/4HANA
2 1 (0.79%) SAP SD
2 1 (0.79%) SAP VC
Cloud Services
1 56 (44.44%) AWS
2 41 (32.54%) Azure
3 27 (21.43%) SaaS
4 23 (18.25%) PaaS
5 22 (17.46%) IaaS
6 14 (11.11%) Serverless
7 13 (10.32%) AWS Lambda
7 13 (10.32%) OpenShift
8 11 (8.73%) Amazon CloudWatch
8 11 (8.73%) Amazon EKS
8 11 (8.73%) AWS CloudTrail
8 11 (8.73%) AWS Elastic Beanstalk
8 11 (8.73%) Azure AKS
8 11 (8.73%) GitHub
9 6 (4.76%) Cloud Computing
10 4 (3.17%) Boomi
10 4 (3.17%) Microsoft 365
11 3 (2.38%) Power Platform
12 2 (1.59%) Amazon ECS
12 2 (1.59%) Salesforce Service Cloud
Communications & Networking
1 5 (3.97%) Firewall
2 2 (1.59%) DHCP
2 2 (1.59%) DNS
2 2 (1.59%) FTP
2 2 (1.59%) TCP/IP
2 2 (1.59%) tcpdump
2 2 (1.59%) Wireshark
3 1 (0.79%) AMQP
3 1 (0.79%) Network Security
3 1 (0.79%) SSL
Database & Business Intelligence
1 16 (12.70%) SQL Server
2 12 (9.52%) PostgreSQL
3 11 (8.73%) Amazon Aurora
3 11 (8.73%) Amazon RDS
4 5 (3.97%) CockroachDB
5 3 (2.38%) MongoDB
5 3 (2.38%) Power BI
5 3 (2.38%) Relational Database
6 2 (1.59%) DynamoDB
6 2 (1.59%) MySQL
7 1 (0.79%) Apache Ignite
7 1 (0.79%) Flink
7 1 (0.79%) NoSQL
7 1 (0.79%) Oracle Database
7 1 (0.79%) RDBMS
7 1 (0.79%) SAP Data Services
Development Applications
1 11 (8.73%) Jenkins
2 5 (3.97%) Git
2 5 (3.97%) Jaeger
2 5 (3.97%) JUnit
2 5 (3.97%) Maven
2 5 (3.97%) Sonatype Nexus
3 3 (2.38%) Cucumber
4 2 (1.59%) Ant
4 2 (1.59%) JIRA
4 2 (1.59%) Subversion
5 1 (0.79%) Atlassian Bamboo
5 1 (0.79%) Bitbucket
5 1 (0.79%) GCC
5 1 (0.79%) GDB
General
1 53 (42.06%) Finance
2 38 (30.16%) Social Skills
3 26 (20.63%) Banking
4 23 (18.25%) Analytical Skills
5 15 (11.90%) Retail Banking
6 13 (10.32%) Financial Institution
7 10 (7.94%) Inclusion and Diversity
8 6 (4.76%) Front Office
9 5 (3.97%) Influencing Skills
9 5 (3.97%) Law
10 4 (3.17%) Documentation Skills
11 3 (2.38%) Back Office
12 2 (1.59%) Wholesale Banking
13 1 (0.79%) Advertising
13 1 (0.79%) Investment Banking
13 1 (0.79%) Presentation Skills
13 1 (0.79%) Prime Brokerage
13 1 (0.79%) Public Sector
13 1 (0.79%) Publishing
Job Titles
1 48 (38.10%) Architect
2 33 (26.19%) Developer
3 22 (17.46%) Solutions Architect
4 17 (13.49%) Salesforce Architect
4 17 (13.49%) Salesforce Solution Architect
4 17 (13.49%) Senior
5 15 (11.90%) Middleware Architect
6 11 (8.73%) AWS DevOps
6 11 (8.73%) AWS DevOps Engineer
6 11 (8.73%) AWS Engineer
6 11 (8.73%) DevOps Engineer
6 11 (8.73%) Java Developer
6 11 (8.73%) Lead
7 9 (7.14%) Technical Architect
8 7 (5.56%) Technical Leader
9 6 (4.76%) Resilience Manager
9 6 (4.76%) Salesforce Developer
9 6 (4.76%) Service Manager
10 5 (3.97%) Cloud Architect
10 5 (3.97%) Payments Architect
Libraries, Frameworks & Software Standards
1 16 (12.70%) Kafka
2 10 (7.94%) .NET
3 7 (5.56%) OAuth
3 7 (5.56%) REST
4 6 (4.76%) SOAP
5 5 (3.97%) ASP.NET
5 5 (3.97%) ASP.NET MVC
5 5 (3.97%) OpenTelemetry
5 5 (3.97%) SailPoint
5 5 (3.97%) Spring Boot
5 5 (3.97%) Visualforce
6 4 (3.17%) Rendezvous
6 4 (3.17%) XML
7 3 (2.38%) J2EE
7 3 (2.38%) JDBC
7 3 (2.38%) JMS
7 3 (2.38%) JSON
7 3 (2.38%) Spring
8 2 (1.59%) HTML5
8 2 (1.59%) Java EE
Miscellaneous
1 21 (16.67%) Enterprise Software
2 19 (15.08%) Public Cloud
3 12 (9.52%) Management Information System
4 11 (8.73%) Distributed Systems
5 8 (6.35%) Cyber Threat
6 6 (4.76%) Foreign Exchange (FX)
6 6 (4.76%) Onboarding
7 5 (3.97%) Equities
8 4 (3.17%) Algorithms
8 4 (3.17%) Cyberattack
8 4 (3.17%) Data Fabric
8 4 (3.17%) Replication
8 4 (3.17%) Virtual Team
9 3 (2.38%) CMDB
9 3 (2.38%) Data Centre
9 3 (2.38%) Robotics
9 3 (2.38%) Self-Motivation
10 2 (1.59%) Credit Risk
10 2 (1.59%) Device Driver
10 2 (1.59%) Team-Oriented Environment
Operating Systems
1 27 (21.43%) Linux
2 17 (13.49%) Windows
3 7 (5.56%) Ubuntu
4 6 (4.76%) CentOS
5 5 (3.97%) Solaris
5 5 (3.97%) Unix
6 4 (3.17%) zOS
7 1 (0.79%) Android
7 1 (0.79%) Apple iOS
7 1 (0.79%) Windows Server
Processes & Methodologies
1 37 (29.37%) Microservices
2 35 (27.78%) DevOps
3 29 (23.02%) CI/CD
4 24 (19.05%) Business Strategy
4 24 (19.05%) Enterprise Architecture
5 23 (18.25%) SOA
5 23 (18.25%) Technical Leadership
6 19 (15.08%) Information Architecture
7 18 (14.29%) Strategic Thinking
8 17 (13.49%) TOGAF
9 15 (11.90%) Disaster Recovery
10 14 (11.11%) Agile
11 13 (10.32%) Problem-Solving
12 11 (8.73%) Analytics
12 11 (8.73%) Change Management
12 11 (8.73%) Test Scripting
13 10 (7.94%) SDLC
14 9 (7.14%) Data Encryption
14 9 (7.14%) Full Stack Development
14 9 (7.14%) Identity Access Management
Programming Languages
1 27 (21.43%) Python
2 24 (19.05%) SQL
3 23 (18.25%) Java
4 13 (10.32%) Bash
5 11 (8.73%) C#
6 7 (5.56%) Apex Code
7 4 (3.17%) C++
7 4 (3.17%) Shell Script
8 3 (2.38%) Go
8 3 (2.38%) Rust
8 3 (2.38%) XPath
9 2 (1.59%) JavaScript
9 2 (1.59%) Perl
10 1 (0.79%) ABAP
10 1 (0.79%) Dart
10 1 (0.79%) Lua
10 1 (0.79%) Objective-C
10 1 (0.79%) PHP
10 1 (0.79%) PL/SQL
10 1 (0.79%) Ruby
Qualifications
1 23 (18.25%) Degree
2 17 (13.49%) TOGAF Certification
3 2 (1.59%) Linux+ Certification
3 2 (1.59%) Microsoft Certification
3 2 (1.59%) RHCE
4 1 (0.79%) AWS Certification
4 1 (0.79%) AWS Certified Solutions Architect
4 1 (0.79%) Azure Certification
Quality Assurance & Compliance
1 2 (1.59%) Data Quality
1 2 (1.59%) SLA
2 1 (0.79%) COREP
2 1 (0.79%) IFRS
2 1 (0.79%) IFRS 17
2 1 (0.79%) IFRS 9
System Software
1 6 (4.76%) Docker
2 3 (2.38%) VMware Infrastructure
3 2 (1.59%) KVM
3 2 (1.59%) Virtual Machines
4 1 (0.79%) Active Directory
4 1 (0.79%) Hyper-V
Systems Management
1 32 (25.40%) Kubernetes
2 13 (10.32%) Grafana
3 11 (8.73%) Terraform
4 7 (5.56%) Ansible
5 6 (4.76%) Single Sign-On
6 5 (3.97%) Kiali
7 2 (1.59%) Control-M
7 2 (1.59%) Progress Chef
7 2 (1.59%) Prometheus
7 2 (1.59%) Puppet
8 1 (0.79%) SCCM
Vendors
1 30 (23.81%) Salesforce
2 16 (12.70%) Oracle
3 15 (11.90%) Red Hat
4 9 (7.14%) Microsoft
4 9 (7.14%) ServiceNow
5 7 (5.56%) IBM
5 7 (5.56%) Splunk
6 5 (3.97%) AppDynamics
7 4 (3.17%) Dell
7 4 (3.17%) MuleSoft
7 4 (3.17%) SAP
7 4 (3.17%) TIBCO
8 3 (2.38%) VMware
9 2 (1.59%) BiZZdesign
9 2 (1.59%) NVIDIA
9 2 (1.59%) SaltStack
9 2 (1.59%) Sparx
10 1 (0.79%) Adobe
10 1 (0.79%) Concur
10 1 (0.79%) webMethods