AWS Jobs in the South East

Amazon Web Services (AWS)
England > South East

The table below provides summary statistics for permanent job vacancies advertised in the South East requiring AWS skills. It includes a benchmarking guide to the annual salaries offered in vacancies that cited AWS over the 6 months leading up to 30 May 2025, comparing them to the same period in the previous two years.

6 months to
30 May 2025
Same period 2024 Same period 2023
Rank 38 27 11
Rank change year-on-year -11 -16 -1
Permanent jobs citing AWS 560 1,190 1,771
As % of all permanent jobs advertised in the South East 5.81% 6.78% 12.61%
As % of the Cloud Services category 26.69% 22.58% 33.97%
Number of salaries quoted 289 914 1,019
10th Percentile £31,250 £40,000 £35,000
25th Percentile £45,000 £46,375 £47,500
Median annual salary (50th Percentile) £57,500 £60,000 £65,000
Median % change year-on-year -4.17% -7.69% -7.14%
75th Percentile £73,750 £73,750 £81,250
90th Percentile £85,000 £88,925 £92,500
England median annual salary £72,500 £70,000 £75,000
% change year-on-year +3.57% -6.67% -

All Cloud Skills
South East

AWS falls under the Cloud Services category. For comparison with the information above, the following table provides summary statistics for all permanent job vacancies requiring cloud computing skills in the South East.

Permanent vacancies with a requirement for cloud computing skills 2,098 5,269 5,213
As % of all permanent jobs advertised in the South East 21.77% 30.04% 37.12%
Number of salaries quoted 1,237 4,062 3,592
10th Percentile £28,750 £28,000 £30,500
25th Percentile £37,500 £37,500 £41,250
Median annual salary (50th Percentile) £55,000 £50,000 £57,000
Median % change year-on-year +10.00% -12.28% +3.64%
75th Percentile £70,000 £65,000 £75,000
90th Percentile £83,750 £80,000 £90,000
England median annual salary £60,000 £57,500 £65,000
% change year-on-year +4.35% -11.54% +4.00%

AWS
Job Vacancy Trend in the South East

Job postings citing AWS as a proportion of all IT jobs advertised in the South East.
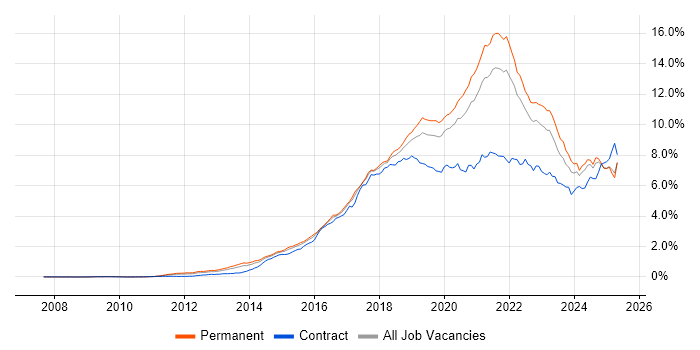
Job vacancy trend for AWS in the South East

AWS
Salary Trend in the South East

3-month moving average salary quoted in jobs citing AWS in the South East.

Salary trend for AWS in the South East

AWS
Salary Histogram in the South East

Salary distribution for jobs citing AWS in the South East over the 6 months to 30 May 2025.

Salary histogram for AWS in the South East

AWS
Job Locations in the South East

The table below looks at the demand and provides a guide to the median salaries quoted in IT jobs citing AWS within the South East region over the 6 months to 30 May 2025. The 'Rank Change' column provides an indication of the change in demand within each location based on the same 6 month period last year.

Location Rank Change
on Same Period
Last Year
Matching
Permanent
IT Job Ads
Median Salary
Past 6 Months
Median Salary
% Change
on Same Period
Last Year
Live
Jobs
Thames Valley -6 227 £60,000 - 1,955
Berkshire -3 133 £64,500 -7.86% 1,250
Hampshire -5 112 £57,500 -8.00% 697
Surrey +10 102 £60,000 +9.09% 450
Oxfordshire -3 62 £55,000 -8.33% 264
Kent -7 43 £42,500 -34.62% 442
Buckinghamshire -9 32 £67,500 +22.73% 445
East Sussex -3 24 £50,000 -23.08% 227
West Sussex +18 23 £30,000 -45.45% 222
Middlesex -7 20 £90,000 +157.14% 2
Sussex +4 1 £75,000 +114.29% 5
Isle of Wight - 1 £47,500 - 1
Home Counties - 1 £70,000 -
AWS
England

AWS
Co-occurring Skills and Capabilities in the South East by Category

The follow tables expand on the table above by listing co-occurrences grouped by category. The same employment type, locality and period is covered with up to 20 co-occurrences shown in each of the following categories:

Application Platforms
1 22 (3.93%) IIS
2 17 (3.04%) Apache Spark
2 17 (3.04%) Confluence
3 15 (2.68%) Microsoft Exchange
4 14 (2.50%) JBoss
4 14 (2.50%) Red Hat Fuse
5 8 (1.43%) OpenStack
6 5 (0.89%) Apache
6 5 (0.89%) Exchange Server 2013
7 4 (0.71%) Apache Airflow
7 4 (0.71%) CMS
8 3 (0.54%) Appian
8 3 (0.54%) Umbraco
9 1 (0.18%) ArcGIS
9 1 (0.18%) Headless CMS
9 1 (0.18%) Strapi
Applications
1 16 (2.86%) Microsoft Office
2 4 (0.71%) Mozilla Thunderbird
3 3 (0.54%) Microsoft Excel
4 2 (0.36%) Microsoft PowerPoint
5 1 (0.18%) S-PLUS
Business Applications
1 1 (0.18%) Eloqua
1 1 (0.18%) Maximo
1 1 (0.18%) Oracle EBS
1 1 (0.18%) Payment Gateway
1 1 (0.18%) SAP S/4HANA
Cloud Services
1 260 (46.43%) Azure
2 149 (26.61%) GCP
3 114 (20.36%) Serverless
4 69 (12.32%) AWS Lambda
5 59 (10.54%) Amazon EKS
6 52 (9.29%) SaaS
7 47 (8.39%) Amazon S3
8 40 (7.14%) Amazon EC2
9 38 (6.79%) Amazon ECS
10 29 (5.18%) AWS CloudFormation
11 28 (5.00%) Microsoft 365
11 28 (5.00%) Snowflake
12 26 (4.64%) Virtual Private Cloud
13 25 (4.46%) Pulumi
14 19 (3.39%) Power Platform
15 17 (3.04%) GitHub
16 16 (2.86%) Azure Monitor
17 15 (2.68%) Azure DevOps
18 13 (2.32%) Amazon SQS
18 13 (2.32%) PaaS
Communications & Networking
1 69 (12.32%) Broadband
2 51 (9.11%) Firewall
3 38 (6.79%) DNS
4 30 (5.36%) DHCP
5 28 (5.00%) VPN
6 26 (4.64%) SSL
7 25 (4.46%) TCP/IP
8 17 (3.04%) WAN
9 16 (2.86%) VLAN
10 15 (2.68%) SAN
11 14 (2.50%) Network Security
12 13 (2.32%) LAN
13 11 (1.96%) SSH
14 10 (1.79%) BGP
14 10 (1.79%) OSPF
15 9 (1.61%) Intrusion Detection
15 9 (1.61%) SD-WAN
16 8 (1.43%) NAS
16 8 (1.43%) Remote Desktop
17 7 (1.25%) Wi-Fi
Database & Business Intelligence
1 74 (13.21%) PostgreSQL
2 63 (11.25%) Relational Database
3 59 (10.54%) SQL Server
4 49 (8.75%) MySQL
5 47 (8.39%) Data Warehouse
6 44 (7.86%) NoSQL
7 43 (7.68%) Data Lake
8 38 (6.79%) RDBMS
9 37 (6.61%) Elasticsearch
10 31 (5.54%) Metadata
11 27 (4.82%) DynamoDB
12 21 (3.75%) Amazon RDS
13 15 (2.68%) Big Data
14 14 (2.50%) MongoDB
15 12 (2.14%) Hadoop
16 9 (1.61%) Power BI
17 8 (1.43%) Amazon Aurora
18 5 (0.89%) Amazon Redshift
18 5 (0.89%) SQLite
19 4 (0.71%) Redis
Development Applications
1 77 (13.75%) Git
2 76 (13.57%) Jenkins
3 42 (7.50%) JUnit
4 31 (5.54%) JIRA
5 25 (4.46%) Jaeger
6 24 (4.29%) Mockito
7 19 (3.39%) GitLab
8 16 (2.86%) Maven
8 16 (2.86%) Rational DOORS
8 16 (2.86%) Selenium
8 16 (2.86%) SonarQube
9 14 (2.50%) JMeter
10 12 (2.14%) TeamCity
11 11 (1.96%) Bitbucket
12 10 (1.79%) NUnit
13 9 (1.61%) Bitbucket Server
13 9 (1.61%) Cucumber
13 9 (1.61%) Jasmine
14 8 (1.43%) Sonatype Nexus
15 6 (1.07%) DbUnit
General
1 168 (30.00%) Social Skills
2 79 (14.11%) Inclusion and Diversity
3 73 (13.04%) Analytical Skills
4 58 (10.36%) Law
5 45 (8.04%) Finance
6 38 (6.79%) Public Sector
7 18 (3.21%) Telecoms
8 16 (2.86%) Military
9 14 (2.50%) Retail
10 13 (2.32%) Banking
10 13 (2.32%) Legal
10 13 (2.32%) Manufacturing
11 11 (1.96%) Presentation Skills
12 8 (1.43%) Marketing
12 8 (1.43%) Pharmaceutical
13 5 (0.89%) Automotive
13 5 (0.89%) Games
13 5 (0.89%) Organisational Skills
14 3 (0.54%) Advertising
14 3 (0.54%) Back Office
Job Titles
1 170 (30.36%) Developer
2 157 (28.04%) Senior
3 82 (14.64%) Lead
4 57 (10.18%) Java Developer
5 52 (9.29%) Full-Stack Developer
6 48 (8.57%) Senior Developer
7 33 (5.89%) Software Developer
8 31 (5.54%) Team Leader
9 30 (5.36%) DevOps Engineer
10 29 (5.18%) Support Engineer
11 27 (4.82%) Cloud Engineer
12 26 (4.64%) Machine Learning Engineer
13 21 (3.75%) IT Support
13 21 (3.75%) Senior Full-Stack Developer
14 20 (3.57%) Architect
14 20 (3.57%) Software Engineer
15 18 (3.21%) .NET Developer
15 18 (3.21%) Principal Engineer
16 17 (3.04%) AWS Engineer
16 17 (3.04%) C# Developer
Libraries, Frameworks & Software Standards
1 97 (17.32%) React
2 75 (13.39%) .NET
3 72 (12.86%) Node.js
4 71 (12.68%) RESTful
5 70 (12.50%) Spring Boot
6 63 (11.25%) Spring
7 59 (10.54%) REST
7 59 (10.54%) Web Services
8 50 (8.93%) HTML
9 45 (8.04%) AngularJS
9 45 (8.04%) Kafka
10 38 (6.79%) CSS
11 34 (6.07%) Elastic Stack
12 32 (5.71%) Hibernate
13 31 (5.54%) Vue
14 27 (4.82%) Apache Camel
15 25 (4.46%) OpenTelemetry
16 23 (4.11%) GraphQL
16 23 (4.11%) Laravel
16 23 (4.11%) SOAP
Miscellaneous
1 45 (8.04%) Management Information System
2 42 (7.50%) Distributed Systems
3 33 (5.89%) Cloud Native
3 33 (5.89%) Self-Motivation
4 29 (5.18%) Cyberattack
5 23 (4.11%) PKI
6 22 (3.93%) Product Ownership
7 20 (3.57%) Onboarding
8 18 (3.21%) Data Centre
9 15 (2.68%) Public Cloud
10 14 (2.50%) Clustering
11 13 (2.32%) Enterprise Software
12 12 (2.14%) Cyber Threat
12 12 (2.14%) Private Cloud
13 10 (1.79%) Client/Server
14 9 (1.61%) Legacy Systems
14 9 (1.61%) Security Posture
15 8 (1.43%) Greenfield Project
15 8 (1.43%) IoT
15 8 (1.43%) Virtual Team
Operating Systems
1 97 (17.32%) Linux
2 57 (10.18%) Windows
3 36 (6.43%) Unix
4 31 (5.54%) Windows Server
5 18 (3.21%) Android
6 5 (0.89%) Ubuntu
7 3 (0.54%) Mac OS
8 2 (0.36%) Red Hat Enterprise Linux
8 2 (0.36%) Windows Server 2019
9 1 (0.18%) Windows Server 2003
Processes & Methodologies
1 216 (38.57%) Agile
2 186 (33.21%) CI/CD
3 156 (27.86%) DevOps
4 110 (19.64%) Microservices
5 109 (19.46%) Problem-Solving
6 101 (18.04%) Full-Stack Development
7 86 (15.36%) Mentoring
8 82 (14.64%) Analytics
8 82 (14.64%) High Availability
9 81 (14.46%) Software Engineering
10 78 (13.93%) Containerisation
10 78 (13.93%) Infrastructure as Code
11 71 (12.68%) Roadmaps
11 71 (12.68%) TDD
12 62 (11.07%) Clean Code
12 62 (11.07%) Kanban
12 62 (11.07%) Scrum
13 59 (10.54%) Computer Science
14 57 (10.18%) Data Science
15 56 (10.00%) Machine Learning
Programming Languages
1 204 (36.43%) Python
2 149 (26.61%) Java
3 138 (24.64%) JavaScript
4 122 (21.79%) SQL
5 78 (13.93%) TypeScript
6 56 (10.00%) Go
7 54 (9.64%) C#
8 39 (6.96%) PowerShell
9 37 (6.61%) Bash
10 30 (5.36%) PHP
11 21 (3.75%) C++
12 19 (3.39%) Shell Script
13 18 (3.21%) Rust
14 5 (0.89%) Kusto Query Language
15 4 (0.71%) Bicep
15 4 (0.71%) C
15 4 (0.71%) R
15 4 (0.71%) Ruby
16 3 (0.54%) Perl
16 3 (0.54%) Scala
Qualifications
1 142 (25.36%) Degree
2 100 (17.86%) Security Cleared
3 55 (9.82%) SC Cleared
4 46 (8.21%) AWS Certification
5 40 (7.14%) DV Cleared
6 35 (6.25%) Computer Science Degree
7 25 (4.46%) PhD
8 24 (4.29%) Master's Degree
9 17 (3.04%) Azure Certification
10 16 (2.86%) BPSS Clearance
11 15 (2.68%) Microsoft Certification
12 10 (1.79%) MCP
13 9 (1.61%) ITIL Certification
14 8 (1.43%) CISSP
14 8 (1.43%) VMware Certified Professional (VCP)
15 7 (1.25%) A+ Certification
16 6 (1.07%) CISM
17 5 (0.89%) CompTIA Security+
17 5 (0.89%) MCSE
18 4 (0.71%) OSCP
Quality Assurance & Compliance
1 55 (9.82%) QA
2 31 (5.54%) Accessibility
3 30 (5.36%) Data Quality
4 25 (4.46%) ISO/IEC 27001
5 23 (4.11%) SLA
6 18 (3.21%) NIST
7 16 (2.86%) GDPR
8 9 (1.61%) California Consumer Privacy Act
8 9 (1.61%) Cyber Essentials
9 5 (0.89%) Cyber Essentials PLUS
9 5 (0.89%) HIPAA
10 2 (0.36%) COBIT
10 2 (0.36%) GRC
11 1 (0.18%) Actionable Recommendations
11 1 (0.18%) GMP
11 1 (0.18%) ISO/IEC 27005
11 1 (0.18%) NCSC
11 1 (0.18%) PCI DSS
11 1 (0.18%) Sarbanes-Oxley
11 1 (0.18%) SOC 2
System Software
1 163 (29.11%) Docker
2 55 (9.82%) Active Directory
3 41 (7.32%) VMware Infrastructure
4 40 (7.14%) Hyper-V
5 17 (3.04%) VMware ESXi
6 15 (2.68%) vSphere
7 12 (2.14%) Virtual Machines
8 7 (1.25%) Virtual Desktop
9 6 (1.07%) BitLocker
9 6 (1.07%) Microsoft App-V
9 6 (1.07%) Terminal Services
10 3 (0.54%) HDFS
11 2 (0.36%) Citrix Hypervisor
11 2 (0.36%) Postfix
11 2 (0.36%) VMware Workstation
12 1 (0.18%) NFS
12 1 (0.18%) vCloud
12 1 (0.18%) VMware NSX
Systems Management
1 167 (29.82%) Kubernetes
2 117 (20.89%) Terraform
3 102 (18.21%) Ansible
4 49 (8.75%) Prometheus
5 27 (4.82%) Kustomize
6 26 (4.64%) Argo
7 24 (4.29%) Grafana
8 16 (2.86%) Puppet
9 13 (2.32%) Kibana
9 13 (2.32%) vCenter Server
10 12 (2.14%) vMotion
11 8 (1.43%) Microsoft Intune
11 8 (1.43%) SCCM
12 7 (1.25%) PowerCLI
12 7 (1.25%) vRealize
13 6 (1.07%) Nagios
14 4 (0.71%) FortiGate
14 4 (0.71%) Nessus
14 4 (0.71%) QRadar
14 4 (0.71%) Single Sign-On
Vendors
1 102 (18.21%) Microsoft
2 61 (10.89%) Google
3 46 (8.21%) VMware
4 24 (4.29%) Cisco
5 21 (3.75%) Splunk
6 16 (2.86%) Citrix
7 13 (2.32%) Dynatrace
7 13 (2.32%) Thales
8 12 (2.14%) HP
9 11 (1.96%) OpenAI
9 11 (1.96%) Oracle
10 10 (1.79%) Rollbar
11 9 (1.61%) Dell
12 8 (1.43%) Databricks
12 8 (1.43%) Solace
13 7 (1.25%) Fortinet
13 7 (1.25%) Veeam
14 6 (1.07%) Atlassian
14 6 (1.07%) Juniper
14 6 (1.07%) Symantec