Linux Jobs in the South East

Linux
England > South East

The table below provides summary statistics for permanent job vacancies advertised in the South East requiring Linux skills. It includes a benchmarking guide to the annual salaries offered in vacancies that cited Linux over the 6 months leading up to 15 May 2025, comparing them to the same period in the previous two years.

6 months to
15 May 2025
Same period 2024 Same period 2023
Rank 55 26 24
Rank change year-on-year -29 -2 -5
Permanent jobs citing Linux 413 1,176 1,198
As % of all permanent jobs advertised in the South East 4.38% 7.01% 8.32%
As % of the Operating Systems category 34.10% 41.54% 43.52%
Number of salaries quoted 254 786 826
10th Percentile £31,250 £34,750 £27,750
25th Percentile £41,250 £40,000 £36,750
Median annual salary (50th Percentile) £52,500 £55,000 £50,000
Median % change year-on-year -4.55% +10.00% -4.76%
75th Percentile £70,000 £68,000 £70,000
90th Percentile £76,750 £82,500 £82,500
England median annual salary £60,000 £56,000 £65,000
% change year-on-year +7.14% -13.85% +8.33%

All Operating Systems
South East

Linux falls under the Operating Systems category. For comparison with the information above, the following table provides summary statistics for all permanent job vacancies requiring operating system skills in the South East.

Permanent vacancies with a requirement for operating system skills 1,211 2,831 2,753
As % of all permanent jobs advertised in the South East 12.85% 16.89% 19.12%
Number of salaries quoted 889 2,269 1,921
10th Percentile £27,000 £26,000 £25,750
25th Percentile £31,750 £31,250 £30,500
Median annual salary (50th Percentile) £40,000 £42,500 £42,500
Median % change year-on-year -5.88% - -10.53%
75th Percentile £55,000 £58,750 £60,000
90th Percentile £70,000 £70,200 £77,500
England median annual salary £45,000 £45,000 £52,500
% change year-on-year - -14.29% -

Linux
Job Vacancy Trend in the South East

Job postings citing Linux as a proportion of all IT jobs advertised in the South East.
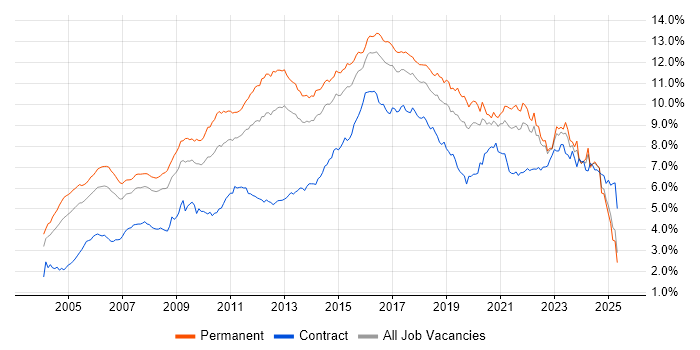
Job vacancy trend for Linux in the South East

Linux
Salary Trend in the South East

3-month moving average salary quoted in jobs citing Linux in the South East.

Salary trend for Linux in the South East

Linux
Salary Histogram in the South East

Salary distribution for jobs citing Linux in the South East over the 6 months to 15 May 2025.

Salary histogram for Linux in the South East

Linux
Job Locations in the South East

The table below looks at the demand and provides a guide to the median salaries quoted in IT jobs citing Linux within the South East region over the 6 months to 15 May 2025. The 'Rank Change' column provides an indication of the change in demand within each location based on the same 6 month period last year.

Location Rank Change
on Same Period
Last Year
Matching
Permanent
IT Job Ads
Median Salary
Past 6 Months
Median Salary
% Change
on Same Period
Last Year
Live
Jobs
Thames Valley -18 168 £52,000 -5.45% 155
Hampshire -18 122 £55,000 -4.35% 87
Surrey -13 75 £55,000 - 45
Berkshire -31 61 £50,000 -15.25% 82
Buckinghamshire +13 54 £50,000 +11.11% 36
Oxfordshire -4 53 £60,000 +41.18% 54
Kent +37 17 £45,000 +12.50% 25
Middlesex -28 13 - - 2
East Sussex +2 6 £42,500 -15.00% 13
West Sussex -1 6 £70,000 +31.46% 15
Sussex - 3 £48,500 - 10
Isle of Wight - 2 £40,101 - 2
Home Counties - 1 £70,000 -
Linux
England

Linux
Co-occurring Skills and Capabilities in the South East by Category

The follow tables expand on the table above by listing co-occurrences grouped by category. The same employment type, locality and period is covered with up to 20 co-occurrences shown in each of the following categories:

Application Platforms
1 17 (4.12%) Confluence
2 13 (3.15%) Apache
3 11 (2.66%) Microsoft Exchange
4 4 (0.97%) OpenStack
5 3 (0.73%) Apache Airflow
6 2 (0.48%) IIS
7 1 (0.24%) GemFire
7 1 (0.24%) nginx
7 1 (0.24%) SharePoint Server
7 1 (0.24%) Tomcat
Applications
1 4 (0.97%) Microsoft Office
1 4 (0.97%) Mozilla Thunderbird
2 2 (0.48%) Microsoft Excel
2 2 (0.48%) OrCAD
2 2 (0.48%) Simulink
Business Applications
1 4 (0.97%) Dynamics NAV
Cloud Services
1 109 (26.39%) AWS
2 95 (23.00%) Azure
3 30 (7.26%) GCP
4 25 (6.05%) Pulumi
5 23 (5.57%) Microsoft 365
6 21 (5.08%) AWS CloudFormation
7 19 (4.60%) Amazon EKS
8 18 (4.36%) SaaS
9 12 (2.91%) PaaS
10 11 (2.66%) Serverless
11 9 (2.18%) Amazon EC2
12 8 (1.94%) Amazon S3
12 8 (1.94%) Azure Sentinel
13 7 (1.69%) AWS KMS
13 7 (1.69%) Virtual Private Cloud
14 6 (1.45%) Entra ID
14 6 (1.45%) OpenShift
15 5 (1.21%) AWS Lambda
15 5 (1.21%) GitHub
15 5 (1.21%) Power Platform
Communications & Networking
1 50 (12.11%) TCP/IP
2 44 (10.65%) VPN
3 34 (8.23%) DNS
4 32 (7.75%) Firewall
5 30 (7.26%) Wireshark
6 26 (6.30%) Broadband
7 23 (5.57%) DHCP
8 18 (4.36%) Wi-Fi
9 14 (3.39%) Network Security
9 14 (3.39%) Wireless
10 12 (2.91%) VLAN
11 11 (2.66%) WAN
12 10 (2.42%) Bluetooth
12 10 (2.42%) LTE
12 10 (2.42%) SAN
13 9 (2.18%) 5G
14 8 (1.94%) NAS
14 8 (1.94%) Remote Desktop
14 8 (1.94%) Software-Defined Radio
15 7 (1.69%) iSCSI
Database & Business Intelligence
1 45 (10.90%) MySQL
2 43 (10.41%) Relational Database
3 31 (7.51%) NoSQL
4 28 (6.78%) RDBMS
5 20 (4.84%) SQL Server
6 18 (4.36%) Elasticsearch
6 18 (4.36%) PostgreSQL
7 9 (2.18%) Amazon RDS
8 5 (1.21%) Metadata
8 5 (1.21%) Power BI
9 4 (0.97%) Azure SQL Database
9 4 (0.97%) DynamoDB
9 4 (0.97%) Metabase
10 3 (0.73%) Airbyte
10 3 (0.73%) Amazon Aurora
10 3 (0.73%) Data Warehouse
10 3 (0.73%) MongoDB
10 3 (0.73%) Qlik Sense
11 2 (0.48%) Cloud Spanner
11 2 (0.48%) Couchbase
Development Applications
1 42 (10.17%) Git
2 40 (9.69%) Robot Framework
3 35 (8.47%) Cucumber
4 32 (7.75%) Jenkins
5 25 (6.05%) Jaeger
6 21 (5.08%) JIRA
7 15 (3.63%) Bitbucket
8 8 (1.94%) GitLab
9 7 (1.69%) Bitbucket Server
9 7 (1.69%) Eclipse
10 5 (1.21%) Eclipse RCP
10 5 (1.21%) JUnit
11 4 (0.97%) Mockito
11 4 (0.97%) SonarQube
12 3 (0.73%) DbUnit
12 3 (0.73%) jMock
12 3 (0.73%) Maven
12 3 (0.73%) Subversion
13 2 (0.48%) CMake
14 1 (0.24%) Jasmine
General
1 105 (25.42%) Social Skills
2 103 (24.94%) Inclusion and Diversity
3 52 (12.59%) Telecoms
4 27 (6.54%) Analytical Skills
5 25 (6.05%) Electronics
6 12 (2.91%) Manufacturing
7 11 (2.66%) Finance
7 11 (2.66%) Retail
8 10 (2.42%) Law
8 10 (2.42%) Public Sector
9 6 (1.45%) Presentation Skills
10 4 (0.97%) Automotive
10 4 (0.97%) Billing
11 3 (0.73%) Advertising
11 3 (0.73%) Organisational Skills
12 2 (0.48%) Aerospace
12 2 (0.48%) Games
12 2 (0.48%) Marketing
12 2 (0.48%) Military
13 1 (0.24%) Local Government
Job Titles
1 51 (12.35%) Software Engineer
2 48 (11.62%) Lead
3 47 (11.38%) Senior
4 40 (9.69%) Support Engineer
5 37 (8.96%) Test Engineer
6 36 (8.72%) Developer
7 35 (8.47%) Principal Engineer
8 34 (8.23%) Infrastructure Engineer
8 34 (8.23%) Principal Systems Engineer
8 34 (8.23%) Test Automation Engineer
9 29 (7.02%) Systems Engineer
10 28 (6.78%) Software Developer
11 27 (6.54%) Team Leader
12 22 (5.33%) Administrator
13 20 (4.84%) Applications Support
14 19 (4.60%) DevOps Engineer
14 19 (4.60%) Embedded Engineer
14 19 (4.60%) Technical Support
15 17 (4.12%) Applications Engineer
15 17 (4.12%) Applications Support Engineer
Libraries, Frameworks & Software Standards
1 33 (7.99%) .NET
2 28 (6.78%) Elastic Stack
2 28 (6.78%) Node.js
3 25 (6.05%) OpenTelemetry
4 21 (5.08%) Pandas
5 19 (4.60%) HTML
6 16 (3.87%) CSS
7 14 (3.39%) React
8 13 (3.15%) Web Services
9 11 (2.66%) LAMP
10 10 (2.42%) Laravel
11 8 (1.94%) REST
12 7 (1.69%) Middleware
13 6 (1.45%) Django
14 5 (1.21%) JSP
14 5 (1.21%) RabbitMQ
14 5 (1.21%) Spring
15 4 (0.97%) Hibernate
15 4 (0.97%) RESTful
15 4 (0.97%) SOAP
Miscellaneous
1 50 (12.11%) Linux Command Line
2 31 (7.51%) Algorithms
3 18 (4.36%) Cyberattack
4 17 (4.12%) Data Centre
4 17 (4.12%) IoT
4 17 (4.12%) Management Information System
4 17 (4.12%) Self-Motivation
5 15 (3.63%) Embedded Systems
6 12 (2.91%) Public Cloud
7 10 (2.42%) Clustering
7 10 (2.42%) Greenfield Project
8 9 (2.18%) NB-IoT
9 8 (1.94%) e-Learning
9 8 (1.94%) MicroBlaze
9 8 (1.94%) PKI
9 8 (1.94%) Replication
9 8 (1.94%) RISC-V
10 7 (1.69%) Cloud Native
11 6 (1.45%) Legacy Systems
11 6 (1.45%) Private Cloud
Operating Systems
1 179 (43.34%) Windows
2 51 (12.35%) Unix
3 38 (9.20%) Windows Server
4 23 (5.57%) Red Hat Enterprise Linux
5 22 (5.33%) Ubuntu
6 19 (4.60%) Android
7 14 (3.39%) Mac OS
8 12 (2.91%) CentOS
8 12 (2.91%) Embedded Linux
9 9 (2.18%) Windows Server 2016
10 8 (1.94%) Debian
10 8 (1.94%) SUSE
11 6 (1.45%) Rocky
12 5 (1.21%) SUSE Linux Enterprise Server
13 2 (0.48%) Windows 10
13 2 (0.48%) Windows Server 2019
14 1 (0.24%) AIX
14 1 (0.24%) FreeRTOS
14 1 (0.24%) Kali Linux
14 1 (0.24%) Windows Server 2003
Processes & Methodologies
1 111 (26.88%) DevOps
2 92 (22.28%) Containerisation
3 91 (22.03%) Agile
4 84 (20.34%) Mentoring
5 83 (20.10%) Software Engineering
6 81 (19.61%) Problem-Solving
7 60 (14.53%) Infrastructure as Code
8 58 (14.04%) High Availability
9 53 (12.83%) Roadmaps
10 51 (12.35%) Coaching
10 51 (12.35%) Mathematics
10 51 (12.35%) OO
10 51 (12.35%) OOP
11 48 (11.62%) CI/CD
12 44 (10.65%) Test Automation
13 41 (9.93%) Computer Science
14 39 (9.44%) Infrastructure Engineering
15 38 (9.20%) Data Analysis
15 38 (9.20%) Systems Engineering
16 37 (8.96%) Continuous Integration
Programming Languages
1 200 (48.43%) Python
2 108 (26.15%) Bash
3 102 (24.70%) JavaScript
4 88 (21.31%) PowerShell
5 76 (18.40%) C++
6 74 (17.92%) Java
7 72 (17.43%) SQL
8 49 (11.86%) Go
9 37 (8.96%) C
10 24 (5.81%) Rust
11 20 (4.84%) C#
12 14 (3.39%) PHP
13 13 (3.15%) PL/SQL
14 10 (2.42%) Fortran
14 10 (2.42%) MATLAB
14 10 (2.42%) Shell Script
15 7 (1.69%) Perl
16 5 (1.21%) Ada
16 5 (1.21%) T-SQL
16 5 (1.21%) TypeScript
Qualifications
1 138 (33.41%) Degree
2 95 (23.00%) Security Cleared
3 58 (14.04%) DV Cleared
4 49 (11.86%) SC Cleared
5 28 (6.78%) BPSS Clearance
6 27 (6.54%) AWS Certification
7 23 (5.57%) Chartered Engineer
8 22 (5.33%) PhD
9 20 (4.84%) Microsoft Certification
10 18 (4.36%) Master's Degree
11 17 (4.12%) Network+ Certification
12 13 (3.15%) Computer Science Degree
13 11 (2.66%) Cisco Certification
13 11 (2.66%) CompTIA Security+
14 10 (2.42%) CCNP
14 10 (2.42%) MCSE
15 9 (2.18%) MCSA
16 8 (1.94%) VMware Certified Professional (VCP)
17 7 (1.69%) CCNA
17 7 (1.69%) MCP
Quality Assurance & Compliance
1 36 (8.72%) QA
2 2 (0.48%) Def Stans
2 2 (0.48%) ISO/IEC 27001
2 2 (0.48%) NIST
2 2 (0.48%) SLA
3 1 (0.24%) Accessibility
3 1 (0.24%) Cyber Essentials
3 1 (0.24%) Data Quality
3 1 (0.24%) GDPR
3 1 (0.24%) PCI DSS
System Software
1 88 (21.31%) Docker
2 65 (15.74%) VMware Infrastructure
3 31 (7.51%) Active Directory
4 25 (6.05%) vSphere
5 24 (5.81%) Hyper-V
6 22 (5.33%) VMware ESXi
7 11 (2.66%) Firmware
8 9 (2.18%) Embedded Firmware
9 6 (1.45%) BitLocker
9 6 (1.45%) Microsoft App-V
9 6 (1.45%) NFS
9 6 (1.45%) Terminal Services
9 6 (1.45%) Virtual Machines
10 4 (0.97%) Virtual Desktop
11 1 (0.24%) Citrix Hypervisor
11 1 (0.24%) KVM
11 1 (0.24%) Postfix
11 1 (0.24%) vCloud
11 1 (0.24%) Virtual Servers
11 1 (0.24%) VMware NSX
Systems Management
1 102 (24.70%) Ansible
2 91 (22.03%) Terraform
3 89 (21.55%) Kubernetes
4 27 (6.54%) Prometheus
5 25 (6.05%) Argo
5 25 (6.05%) Kustomize
6 21 (5.08%) Puppet
7 10 (2.42%) vCenter Server
8 6 (1.45%) FortiGate
8 6 (1.45%) Nagios
8 6 (1.45%) Nessus
8 6 (1.45%) Proxmox
8 6 (1.45%) vMotion
9 4 (0.97%) Progress Chef
10 3 (0.73%) Microsoft Intune
10 3 (0.73%) PaperCut
10 3 (0.73%) WMI
11 2 (0.48%) Packer
11 2 (0.48%) ZABBIX
11 2 (0.48%) ZENworks
Vendors
1 83 (20.10%) Microsoft
2 70 (16.95%) VMware
3 32 (7.75%) Red Hat
4 31 (7.51%) Google
5 27 (6.54%) Cisco
6 18 (4.36%) Atlassian
7 15 (3.63%) SAP
8 11 (2.66%) HP
8 11 (2.66%) Juniper
8 11 (2.66%) Palo Alto
9 9 (2.18%) Dell
9 9 (2.18%) Veeam
10 7 (1.69%) Aruba
11 6 (1.45%) Citrix
11 6 (1.45%) Symantec
12 5 (1.21%) NVIDIA
12 5 (1.21%) SevOne
13 4 (0.97%) Oracle
13 4 (0.97%) ServiceNow
14 3 (0.73%) IBM