Cisco Certified Internetwork Expert (CCIE)
UK

The following table provides summary statistics for permanent job vacancies with a requirement for CCIE qualifications. Included is a benchmarking guide to the salaries offered over the 6 months to 30 November 2023 with a comparison to the same period in the previous 2 years.

6 months to
30 Nov 2023
Same period 2022 Same period 2021
Rank 600 810 846
Rank change year-on-year +210 +36 -250
Permanent jobs citing CCIE 127 284 259
As % of all permanent jobs advertised in the UK 0.24% 0.22% 0.20%
As % of the Qualifications category 0.72% 0.76% 0.81%
Number of salaries quoted 114 194 223
10th Percentile £51,036 £50,250 £43,000
25th Percentile £61,250 £61,250 £61,875
Median annual salary (50th Percentile) £80,000 £80,000 £80,000
Median % change year-on-year - - +14.29%
75th Percentile £94,688 £95,000 £87,500
90th Percentile £101,000 £100,000 £95,000
UK excluding London median annual salary £62,500 £80,000 £75,000
% change year-on-year -21.88% +6.67% +33.33%

All Academic and Professional Certifications
UK

CCIE is in the Academic Qualifications and Professional Certifications category. The following table is for comparison with the above and provides summary statistics for all permanent job vacancies with a requirement for academic qualifications or professional certifications.

Permanent vacancies requiring academic qualifications or professional certifications 17,523 37,320 32,078
As % of all permanent jobs advertised in the UK 32.54% 29.53% 24.78%
Number of salaries quoted 10,978 17,212 17,882
10th Percentile £31,250 £31,250 £31,250
25th Percentile £42,102 £41,250 £40,853
Median annual salary (50th Percentile) £57,500 £57,000 £55,000
Median % change year-on-year +0.88% +3.64% -
75th Percentile £75,000 £76,250 £72,500
90th Percentile £92,500 £93,750 £90,000
UK excluding London median annual salary £52,500 £50,000 £49,590
% change year-on-year +5.00% +0.83% +1.20%

CCIE
Job Vacancy Trend

Job postings citing CCIE as a proportion of all IT jobs advertised.
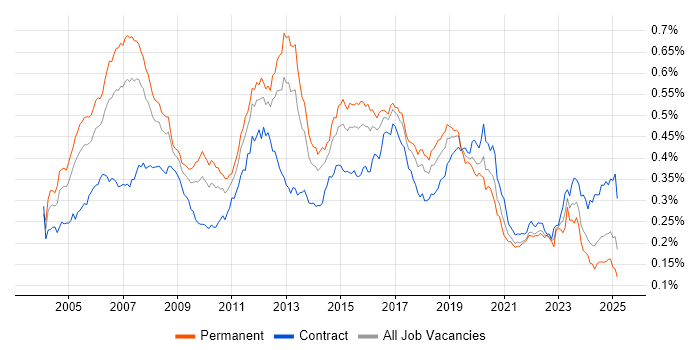
Job vacancy trend for CCIE in the UK

CCIE
Salary Trend

3-month moving average salary quoted in jobs citing CCIE.

Salary trend for CCIE in the UK

CCIE
Salary Histogram

Salary distribution for jobs citing CCIE over the 6 months to 30 November 2023.

Salary histogram for CCIE in the UK

CCIE
Top 14 Job Locations

The table below looks at the demand and provides a guide to the median salaries quoted in IT jobs citing CCIE within the UK over the 6 months to 30 November 2023. The 'Rank Change' column provides an indication of the change in demand within each location based on the same 6 month period last year.

Location Rank Change
on Same Period
Last Year
Matching
Permanent
IT Job Ads
Median Salary
Past 6 Months
Median Salary
% Change
on Same Period
Last Year
Live
Jobs
England +193 114 £80,000 +6.67% 41
London +192 78 £86,250 +15.00% 24
Work from Home +164 51 £80,000 - 26
UK excluding London +206 37 £62,500 -21.88% 25
West Midlands +133 14 £80,000 -5.88% 5
Midlands +126 14 £80,000 -5.88% 5
North of England +149 13 £80,000 -5.88% 8
South East +124 11 £81,250 -4.41% 4
East of England +125 10 £73,750 +47.50%
North West +113 10 £81,250 +1.56% 5
South West +75 6 £58,536 -21.95% 5
Yorkshire +81 5 £80,000 -5.88% 1
Scotland +58 4 £59,286 - 4
North East +45 3 £85,000 +6.25% 2

CCIE
Co-occurring Skills and Capabilities by Category

The follow tables expand on the table above by listing co-occurrences grouped by category. The same employment type, locality and period is covered with up to 20 co-occurrences shown in each of the following categories:

Application Platforms
1 5 (3.94%) Confluence
2 3 (2.36%) MS Exchange
2 3 (2.36%) OpenStack
Applications
1 5 (3.94%) Microsoft Excel
2 4 (3.15%) Microsoft Office
3 3 (2.36%) MS Visio
Cloud Services
1 18 (14.17%) Azure
2 14 (11.02%) AWS
3 5 (3.94%) GCP
4 3 (2.36%) Azure Sentinel
4 3 (2.36%) Microsoft 365
5 2 (1.57%) SaaS
6 1 (0.79%) GitHub
6 1 (0.79%) IaaS
6 1 (0.79%) PaaS
Communications & Networking
1 76 (59.84%) Firewall
2 62 (48.82%) WAN
3 54 (42.52%) BGP
3 54 (42.52%) OSPF
4 53 (41.73%) LAN
5 44 (34.65%) Wireless
6 37 (29.13%) SD-WAN
7 32 (25.20%) MPLS
8 31 (24.41%) Network Security
9 27 (21.26%) Cisco Nexus
10 24 (18.90%) Cisco Firepower
10 24 (18.90%) VPN
11 21 (16.54%) TCP/IP
12 19 (14.96%) IPsec
12 19 (14.96%) VLAN
12 19 (14.96%) VRRP
13 17 (13.39%) WLAN
14 16 (12.60%) Cisco ASA
15 14 (11.02%) Cisco IOS
15 14 (11.02%) Multicast
Development Applications
1 8 (6.30%) JIRA
2 5 (3.94%) Sonatype Nexus
3 1 (0.79%) GitLab
General
1 33 (25.98%) Social Skills
2 26 (20.47%) Finance
3 14 (11.02%) Telecoms
4 13 (10.24%) Banking
5 9 (7.09%) Legal
6 8 (6.30%) Law
7 6 (4.72%) Analytical Skills
8 5 (3.94%) Documentation Skills
8 5 (3.94%) Influencing Skills
8 5 (3.94%) Mandarin Language
9 4 (3.15%) Presentation Skills
9 4 (3.15%) Retail
10 3 (2.36%) Military
10 3 (2.36%) Organisational Skills
11 2 (1.57%) Advertising
11 2 (1.57%) Financial Institution
11 2 (1.57%) Police
12 1 (0.79%) Manufacturing
12 1 (0.79%) Multimedia
12 1 (0.79%) Pharmaceutical
Job Titles
1 42 (33.07%) Network Engineer
2 34 (26.77%) Senior
3 23 (18.11%) Architect
4 18 (14.17%) Senior Network Engineer
5 17 (13.39%) Consultant
6 16 (12.60%) Network Architect
7 13 (10.24%) Network Consultant
8 12 (9.45%) Network Manager
9 10 (7.87%) Cisco Engineer
9 10 (7.87%) Cisco Network Engineer
9 10 (7.87%) Design Engineer
10 9 (7.09%) Security Consultant
10 9 (7.09%) Security Engineer
11 7 (5.51%) Network Security Consultant
11 7 (5.51%) Senior Manager
11 7 (5.51%) Senior Network Manager
11 7 (5.51%) Support Engineer
11 7 (5.51%) Technical Engineer
11 7 (5.51%) Technical Support
11 7 (5.51%) Technical Support Engineer
Libraries, Frameworks & Software Standards
1 12 (9.45%) 802.1X
2 3 (2.36%) HTML
3 2 (1.57%) CSS
3 2 (1.57%) XMPP
Miscellaneous
1 47 (37.01%) Data Centre
2 9 (7.09%) Public Cloud
3 6 (4.72%) Reinsurance
4 4 (3.15%) Replication
5 3 (2.36%) Hedge funds
5 3 (2.36%) Hybrid Cloud
5 3 (2.36%) IoT
5 3 (2.36%) Operational Technology
5 3 (2.36%) PKI
6 2 (1.57%) Enterprise Software
6 2 (1.57%) Management Information System
6 2 (1.57%) Private Cloud
6 2 (1.57%) Smart City
6 2 (1.57%) Virtual Team
7 1 (0.79%) CCTV
7 1 (0.79%) Legacy Systems
7 1 (0.79%) Onboarding
7 1 (0.79%) Security Posture
Operating Systems
1 7 (5.51%) Linux
2 4 (3.15%) Windows
2 4 (3.15%) Windows Server
3 2 (1.57%) Unix
Processes & Methodologies
1 19 (14.96%) Network Design
2 15 (11.81%) Network Architecture
2 15 (11.81%) Project Delivery
3 14 (11.02%) Network Virtualisation
4 13 (10.24%) Mentoring
5 12 (9.45%) ITIL
5 12 (9.45%) Load Balancing
6 11 (8.66%) Service Delivery
7 10 (7.87%) Customer Service
7 10 (7.87%) Network Management
7 10 (7.87%) Roadmaps
7 10 (7.87%) TOGAF
8 9 (7.09%) Change Management
8 9 (7.09%) Incident Management
8 9 (7.09%) Low Latency
9 8 (6.30%) High Availability
9 8 (6.30%) Migration
9 8 (6.30%) Presales
9 8 (6.30%) Project Management
9 8 (6.30%) Supplier Management
Programming Languages
1 6 (4.72%) Python
2 3 (2.36%) C#
2 3 (2.36%) Perl
2 3 (2.36%) PowerShell
2 3 (2.36%) SQL
Qualifications
1 127 (100.00%) Cisco Certification
2 105 (82.68%) CCNP
3 27 (21.26%) CCNA
4 22 (17.32%) Degree
5 17 (13.39%) CCIE Routing and Switching
6 13 (10.24%) CCDP
6 13 (10.24%) CISSP
7 12 (9.45%) Security Cleared
8 9 (7.09%) SC Cleared
8 9 (7.09%) TOGAF Certification
9 8 (6.30%) JNCIE
10 7 (5.51%) Azure Certification
10 7 (5.51%) CWAP
10 7 (5.51%) CWNA
11 6 (4.72%) CCIE Security
12 5 (3.94%) CCSP
13 4 (3.15%) CCIE Service Provider
13 4 (3.15%) MCT
14 3 (2.36%) Computer Science Degree
14 3 (2.36%) DV Cleared
Quality Assurance & Compliance
1 6 (4.72%) SLA
2 3 (2.36%) Accessibility
3 2 (1.57%) ISO/IEC 27001
3 2 (1.57%) NIST
3 2 (1.57%) QA
System Software
1 8 (6.30%) VMware Infrastructure
2 5 (3.94%) Active Directory
3 3 (2.36%) Hyper-V
Systems Management
1 10 (7.87%) FortiGate
2 9 (7.09%) Cisco CUCM
3 3 (2.36%) Microsoft Intune
3 3 (2.36%) Stealthwatch
3 3 (2.36%) Terraform
3 3 (2.36%) vCenter Server
4 2 (1.57%) Kubernetes
5 1 (0.79%) Ansible
5 1 (0.79%) Cisco Prime
5 1 (0.79%) Grafana
5 1 (0.79%) ZABBIX
Vendors
1 97 (76.38%) Cisco
2 43 (33.86%) Palo Alto
3 25 (19.69%) Juniper
4 24 (18.90%) CheckPoint
4 24 (18.90%) Meraki
5 21 (16.54%) Aruba
6 20 (15.75%) Riverbed
7 19 (14.96%) Fortinet
8 14 (11.02%) F5
9 13 (10.24%) Microsoft
10 10 (7.87%) Huawei
10 10 (7.87%) VMware
11 6 (4.72%) NetApp
11 6 (4.72%) Salesforce
12 5 (3.94%) Symantec
13 4 (3.15%) Arista
13 4 (3.15%) Blue Coat
14 3 (2.36%) FireEye
14 3 (2.36%) Splunk
14 3 (2.36%) Zscaler