Presales
UK

The following table provides summary statistics for permanent job vacancies with a requirement for Presales skills. Included is a benchmarking guide to the salaries offered in vacancies that have cited Presales over the 6 months to 4 December 2023 with a comparison to the same period in the previous 2 years.

6 months to
4 Dec 2023
Same period 2022 Same period 2021
Rank 118 214 170
Rank change year-on-year +96 -44 +20
Permanent jobs citing Presales 1,484 2,138 2,900
As % of all permanent jobs advertised in the UK 2.79% 1.72% 2.26%
As % of the Processes & Methodologies category 2.96% 1.80% 2.37%
Number of salaries quoted 512 1,446 1,840
10th Percentile £45,000 £43,750 £43,750
25th Percentile £52,750 £57,500 £52,500
Median annual salary (50th Percentile) £70,000 £75,000 £70,000
Median % change year-on-year -6.67% +7.14% +3.70%
75th Percentile £90,000 £95,000 £90,000
90th Percentile £97,375 £115,000 £105,000
UK excluding London median annual salary £57,500 £65,000 £60,000
% change year-on-year -11.54% +8.33% -

All Process and Methodology Skills
UK

Presales is in the Processes and Methodologies category. The following table is for comparison with the above and provides summary statistics for all permanent job vacancies with a requirement for process or methodology skills.

Permanent vacancies with a requirement for process or methodology skills 50,088 118,671 122,416
As % of all permanent jobs advertised in the UK 94.09% 95.74% 95.45%
Number of salaries quoted 36,209 72,079 81,851
10th Percentile £32,500 £34,492 £32,500
25th Percentile £43,750 £45,000 £42,500
Median annual salary (50th Percentile) £60,000 £60,000 £60,000
Median % change year-on-year - - +9.09%
75th Percentile £80,000 £82,000 £77,500
90th Percentile £99,025 £100,000 £95,000
UK excluding London median annual salary £52,500 £53,219 £50,000
% change year-on-year -1.35% +6.44% +4.17%

Presales
Job Vacancy Trend

Job postings citing Presales as a proportion of all IT jobs advertised.
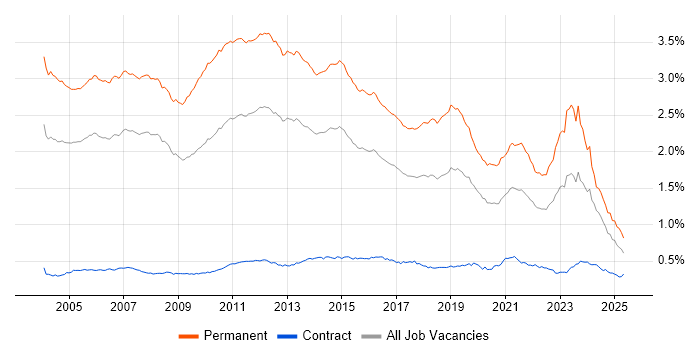
Job vacancy trend for Presales in the UK

Presales
Salary Trend

3-month moving average salary quoted in jobs citing Presales.

Salary trend for Presales in the UK

Presales
Salary Histogram

Salary distribution for jobs citing Presales over the 6 months to 4 December 2023.

Salary histogram for Presales in the UK

Presales
Top 17 Job Locations

The table below looks at the demand and provides a guide to the median salaries quoted in IT jobs citing Presales within the UK over the 6 months to 4 December 2023. The 'Rank Change' column provides an indication of the change in demand within each location based on the same 6 month period last year.

Location Rank Change
on Same Period
Last Year
Matching
Permanent
IT Job Ads
Median Salary
Past 6 Months
Median Salary
% Change
on Same Period
Last Year
Live
Jobs
Work from Home +122 1,105 £75,000 - 265
England +103 1,044 £70,000 -6.67% 549
UK excluding London +172 911 £57,500 -11.54% 279
London +79 360 £82,500 -2.94% 263
North of England +178 242 £55,000 -12.00% 46
North West +131 156 £61,250 +16.67% 24
Scotland +69 149 £50,000 -13.79% 14
South East +79 146 £55,000 -15.38% 92
Midlands +110 109 £65,000 -7.14% 78
South West +96 84 £75,000 +15.38% 31
Yorkshire +122 82 £55,000 -21.43% 16
Northern Ireland +92 79 £80,000 +52.38% 2
East Midlands +99 71 £70,000 +3.70% 18
Wales +74 64 £50,000 -4.76% 2
East of England +79 38 £50,000 -11.11% 18
West Midlands +69 38 £65,000 -7.14% 60
North East +48 4 £35,000 -33.33% 6

Presales
Co-occurring Skills and Capabilities by Category

The follow tables expand on the table above by listing co-occurrences grouped by category. The same employment type, locality and period is covered with up to 20 co-occurrences shown in each of the following categories:

Application Platforms
1 27 (1.82%) SharePoint
2 12 (0.81%) Confluence
3 8 (0.54%) CMS
3 8 (0.54%) Kentico
4 6 (0.40%) MS Exchange
5 5 (0.34%) nginx
6 4 (0.27%) OpenStack
7 2 (0.13%) Alfresco
7 2 (0.13%) Documentum
7 2 (0.13%) FileNet
7 2 (0.13%) IIS
7 2 (0.13%) Moodle
8 1 (0.067%) EPiServer
8 1 (0.067%) Exchange Server 2013
8 1 (0.067%) Headless CMS
8 1 (0.067%) NetWeaver
8 1 (0.067%) SAS
8 1 (0.067%) Sitecore CMS
8 1 (0.067%) Umbraco
Applications
1 9 (0.61%) Microsoft Excel
2 8 (0.54%) InDesign
2 8 (0.54%) Photoshop
3 6 (0.40%) Microsoft Office
4 4 (0.27%) Microsoft Project
5 2 (0.13%) MS Visio
6 1 (0.067%) Microsoft PowerPoint
Business Applications
1 233 (15.70%) Dynamics CRM
2 42 (2.83%) Remedy ITSM
3 18 (1.21%) Elite 3E
3 18 (1.21%) SAP ERP
3 18 (1.21%) SAP S/4HANA
4 15 (1.01%) NetSuite
5 5 (0.34%) SAP Payroll
6 4 (0.27%) SAP Business One
7 3 (0.20%) Salesforce CRM
7 3 (0.20%) SAP CRM
7 3 (0.20%) SAP Oil and Gas
7 3 (0.20%) Shopify
8 2 (0.13%) Oracle Applications
8 2 (0.13%) Oracle EBS
8 2 (0.13%) Oracle General Ledger
8 2 (0.13%) Oracle Payables
8 2 (0.13%) Oracle Receivables
8 2 (0.13%) SAP CO
8 2 (0.13%) SAP FI/CO
8 2 (0.13%) SAP PP
Cloud Services
1 445 (29.99%) Azure
2 338 (22.78%) SaaS
3 285 (19.20%) Power Platform
4 263 (17.72%) Dynamics 365
5 242 (16.31%) PaaS
6 237 (15.97%) IaaS
7 232 (15.63%) Serverless
8 220 (14.82%) Azure Functions
9 121 (8.15%) AWS
10 91 (6.13%) Microsoft 365
11 33 (2.22%) PowerApps
12 25 (1.68%) Azure DevOps
13 20 (1.35%) SuccessFactors
14 15 (1.01%) Entra ID
15 12 (0.81%) Power Automate
16 10 (0.67%) Cloud Computing
17 7 (0.47%) GCP
18 6 (0.40%) AWS Lambda
19 5 (0.34%) CloudFront
19 5 (0.34%) Microsoft Purview
Communications & Networking
1 69 (4.65%) Firewall
2 46 (3.10%) VPN
3 43 (2.90%) WAN
4 35 (2.36%) SSL
5 32 (2.16%) LAN
6 31 (2.09%) SD-WAN
7 24 (1.62%) VLAN
8 23 (1.55%) SAN
9 21 (1.42%) Network Security
10 18 (1.21%) Wi-Fi
11 16 (1.08%) Cisco ASA
11 16 (1.08%) TCP/IP
12 13 (0.88%) Cisco Nexus
13 12 (0.81%) Wireless
14 10 (0.67%) MPLS
15 9 (0.61%) Cisco ISE
15 9 (0.61%) HTTP
15 9 (0.61%) Unified Communications
16 8 (0.54%) OSPF
16 8 (0.54%) Software-Defined Networking
Database & Business Intelligence
1 76 (5.12%) Data Warehouse
2 40 (2.70%) SQL Server
3 38 (2.56%) Power BI
4 26 (1.75%) Relational Database
5 22 (1.48%) SQL Server Reporting Services
6 19 (1.28%) MySQL
7 13 (0.88%) Big Data
8 10 (0.67%) NoSQL
9 7 (0.47%) Data Lake
10 6 (0.40%) Amazon RDS
11 4 (0.27%) Amazon Redshift
11 4 (0.27%) Crystal Reports
11 4 (0.27%) SAP HANA
12 3 (0.20%) BigQuery
12 3 (0.20%) BusinessObjects Business Intelligence
12 3 (0.20%) DynamoDB
13 2 (0.13%) Amazon Athena
13 2 (0.13%) Bigtable
13 2 (0.13%) Oracle Database
14 1 (0.067%) Looker
Development Applications
1 25 (1.68%) JIRA
2 19 (1.28%) Jenkins
3 13 (0.88%) GitLab
4 12 (0.81%) Selenium
5 8 (0.54%) JMeter
5 8 (0.54%) SoapUI
5 8 (0.54%) TestLink
6 3 (0.20%) Octopus Deploy
6 3 (0.20%) Oracle Forms
6 3 (0.20%) TeamCity
7 2 (0.13%) Visual Studio
8 1 (0.067%) Burp Suite
8 1 (0.067%) Git
8 1 (0.067%) Metasploit
General
1 672 (45.28%) Social Skills
2 387 (26.08%) Finance
3 87 (5.86%) Public Sector
4 83 (5.59%) Marketing
5 74 (4.99%) Presentation Skills
5 74 (4.99%) Retail
6 63 (4.25%) Inclusion and Diversity
7 61 (4.11%) Analytical Skills
8 44 (2.96%) Manufacturing
9 31 (2.09%) Aerospace
10 26 (1.75%) Legal
11 24 (1.62%) Automotive
11 24 (1.62%) Aviation
12 22 (1.48%) Law
13 21 (1.42%) Banking
13 21 (1.42%) Billing
14 18 (1.21%) Telecoms
15 16 (1.08%) Advertising
16 15 (1.01%) Organisational Skills
17 14 (0.94%) Electronics
Job Titles
1 762 (51.35%) Architect
2 446 (30.05%) Solutions Architect
3 259 (17.45%) Presales Solution Architect
4 222 (14.96%) CRM Architect
5 221 (14.89%) Dynamics 365 Architect
6 220 (14.82%) Dynamics CRM Architect
7 219 (14.76%) Consultant
8 206 (13.88%) Senior
9 129 (8.69%) Lead
10 104 (7.01%) Project Manager
11 101 (6.81%) Senior Architect
12 100 (6.74%) Senior Solutions Architect
13 60 (4.04%) Technical Consultant
14 59 (3.98%) Senior Consultant
15 53 (3.57%) Presales Manager
16 44 (2.96%) Network Architect
17 34 (2.29%) Presales Consultant
17 34 (2.29%) Technical Architect
18 30 (2.02%) Analyst
19 29 (1.95%) Development Manager
Libraries, Frameworks & Software Standards
1 61 (4.11%) SOAP
2 49 (3.30%) HTML
3 45 (3.03%) Web Services
4 43 (2.90%) .NET
5 42 (2.83%) XML
6 27 (1.82%) CSS
7 24 (1.62%) Ajax
7 24 (1.62%) LDAP
8 22 (1.48%) REST
9 20 (1.35%) JSON
10 17 (1.15%) RESTful
11 9 (0.61%) Middleware
12 8 (0.54%) ASP.NET
13 7 (0.47%) Next.js
14 6 (0.40%) React
15 5 (0.34%) .NET Core
15 5 (0.34%) ARM Templates
16 4 (0.27%) .NET Framework
16 4 (0.27%) HTML5
16 4 (0.27%) OpenDaylight
Miscellaneous
1 85 (5.73%) Cloud Native
2 76 (5.12%) Data Structures
3 48 (3.23%) Low-Code
4 46 (3.10%) Self-Motivation
5 45 (3.03%) Data Centre
6 36 (2.43%) Management Information System
7 31 (2.09%) Public Cloud
8 25 (1.68%) CMDB
9 23 (1.55%) Legacy Systems
9 23 (1.55%) Virtual Team
10 21 (1.42%) Onboarding
11 19 (1.28%) Replication
12 15 (1.01%) Social Media
13 14 (0.94%) Driving Licence
14 12 (0.81%) Hybrid Cloud
15 9 (0.61%) PKI
16 8 (0.54%) Marketing Technology
17 7 (0.47%) FMCG
17 7 (0.47%) Learning Management System
17 7 (0.47%) Operational Technology
Operating Systems
1 48 (3.23%) Windows
2 36 (2.43%) Linux
3 25 (1.68%) Windows Server
4 16 (1.08%) Windows Server 2012
5 14 (0.94%) SUSE
5 14 (0.94%) Ubuntu
6 3 (0.20%) VMS
6 3 (0.20%) Windows 10
7 2 (0.13%) Red Hat Enterprise Linux
7 2 (0.13%) Unix
7 2 (0.13%) Windows Server 2016
8 1 (0.067%) Data ONTAP
8 1 (0.067%) Windows Server 2019
Processes & Methodologies
1 765 (51.55%) Actionable Insight
2 502 (33.83%) Agile
3 433 (29.18%) Thought Leadership
4 381 (25.67%) Problem-Solving
5 371 (25.00%) Digital Transformation Programme
6 362 (24.39%) Business Case
7 305 (20.55%) Analytics
8 280 (18.87%) Roadmaps
9 276 (18.60%) CRM
10 254 (17.12%) Software Delivery
11 246 (16.58%) Commercial Awareness
12 245 (16.51%) Technology Strategy
13 244 (16.44%) Data Analytics
13 244 (16.44%) IT Strategy
14 243 (16.37%) Contract Negotiation
15 229 (15.43%) Strategic Roadmap
16 227 (15.30%) Project Planning
17 220 (14.82%) Work Breakdown Structure
18 212 (14.29%) Project Management
19 189 (12.74%) Project Delivery
Programming Languages
1 93 (6.27%) JavaScript
2 50 (3.37%) SQL
3 42 (2.83%) Python
4 27 (1.82%) Java
5 25 (1.68%) PowerShell
6 20 (1.35%) C#
7 18 (1.21%) Perl
8 13 (0.88%) Bash
9 11 (0.74%) PHP
9 11 (0.74%) TypeScript
10 8 (0.54%) C++
11 6 (0.40%) C
11 6 (0.40%) Kusto Query Language
12 5 (0.34%) ABAP
13 3 (0.20%) Bicep
14 1 (0.067%) Go
14 1 (0.067%) Ruby
14 1 (0.067%) VB
Qualifications
1 387 (26.08%) Security Cleared
2 331 (22.30%) SC Cleared
3 148 (9.97%) Degree
4 73 (4.92%) TOGAF Certification
5 39 (2.63%) Cisco Certification
6 31 (2.09%) DV Cleared
7 30 (2.02%) BPSS Clearance
7 30 (2.02%) CCNP
8 28 (1.89%) Microsoft Certification
9 27 (1.82%) CCNA
10 20 (1.35%) Computer Science Degree
11 18 (1.21%) MCSE
12 17 (1.15%) VMware Certified Professional (VCP)
13 15 (1.01%) MCSA
14 13 (0.88%) Master's Degree
15 7 (0.47%) Azure Certification
15 7 (0.47%) CCIE
16 6 (0.40%) ITIL Certification
16 6 (0.40%) PhD
17 5 (0.34%) PMP
Quality Assurance & Compliance
1 38 (2.56%) QA
2 10 (0.67%) PMO
2 10 (0.67%) SLA
3 4 (0.27%) COBIT
3 4 (0.27%) GRC
3 4 (0.27%) NIST
4 3 (0.20%) Cyber Essentials
5 2 (0.13%) GDPR
5 2 (0.13%) ISO/IEC 27001
6 1 (0.067%) Accessibility
6 1 (0.067%) Actionable Recommendations
6 1 (0.067%) IASME
6 1 (0.067%) ISO 9001
6 1 (0.067%) MiFID
System Software
1 37 (2.49%) VMware Infrastructure
2 32 (2.16%) Active Directory
3 17 (1.15%) Docker
3 17 (1.15%) vCloud
4 15 (1.01%) vSphere
5 9 (0.61%) Hyper-V
6 6 (0.40%) Virtual Machines
6 6 (0.40%) VMware NSX
7 2 (0.13%) Virtual Desktop
7 2 (0.13%) VMware ESXi
8 1 (0.067%) Oracle RAC
8 1 (0.067%) Squid
8 1 (0.067%) Terminal Services
Systems Management
1 26 (1.75%) Terraform
2 24 (1.62%) HP UCMDB
3 23 (1.55%) Kubernetes
4 20 (1.35%) FortiGate
5 19 (1.28%) Microsoft Intune
6 13 (0.88%) Ansible
7 6 (0.40%) CSIRT
8 4 (0.27%) Active Directory Federation Services
8 4 (0.27%) vCenter Server
9 3 (0.20%) Cisco Prime
9 3 (0.20%) Failover Clustering
9 3 (0.20%) Nagios
9 3 (0.20%) Puppet
10 2 (0.13%) SCCM
11 1 (0.067%) Backup Exec
11 1 (0.067%) Nessus
11 1 (0.067%) Nmap
11 1 (0.067%) Oracle RMAN
11 1 (0.067%) Progress Chef
11 1 (0.067%) SCVMM
Vendors
1 389 (26.21%) Microsoft
2 85 (5.73%) SAP
3 72 (4.85%) Cisco
4 66 (4.45%) Oracle
5 64 (4.31%) HP
6 57 (3.84%) ServiceNow
6 57 (3.84%) VMware
7 43 (2.90%) BMC
8 42 (2.83%) Remedy
9 40 (2.70%) Dell
10 27 (1.82%) Fortinet
10 27 (1.82%) Salesforce
11 24 (1.62%) Palo Alto
12 21 (1.42%) Veeam
13 18 (1.21%) Juniper
14 17 (1.15%) Aruba
15 16 (1.08%) Meraki
16 15 (1.01%) Qualtrics
17 14 (0.94%) Fujitsu
18 12 (0.81%) Citrix