Customer Engagement Jobs

Customer Engagement
UK

The table below provides summary statistics for permanent job vacancies requiring Customer Engagement skills. It includes a benchmarking guide to the annual salaries offered in vacancies that cited Customer Engagement over the 6 months leading up to 30 May 2025, comparing them to the same period in the previous two years.

6 months to
30 May 2025
Same period 2024 Same period 2023
Rank 325 479 324
Rank change year-on-year +154 -155 +137
Permanent jobs citing Customer Engagement 480 488 1,037
As % of all permanent jobs advertised in the UK 0.87% 0.47% 1.07%
As % of the Processes & Methodologies category 0.92% 0.56% 1.12%
Number of salaries quoted 212 311 381
10th Percentile £30,500 £31,250 £37,500
25th Percentile £40,000 £38,000 £53,250
Median annual salary (50th Percentile) £55,000 £57,500 £70,000
Median % change year-on-year -4.35% -17.86% +12.00%
75th Percentile £76,250 £80,000 £88,750
90th Percentile £96,250 £105,000 £97,500
UK excluding London median annual salary £50,000 £46,250 £59,500
% change year-on-year +8.11% -22.27% +8.18%

All Process and Methodology Skills
UK

Customer Engagement falls under the Processes and Methodologies category. For comparison with the information above, the following table provides summary statistics for all permanent job vacancies requiring process or methodology skills.

Permanent vacancies with a requirement for process or methodology skills 51,902 86,889 92,846
As % of all permanent jobs advertised in the UK 93.67% 84.13% 95.56%
Number of salaries quoted 25,611 60,763 54,796
10th Percentile £28,822 £29,250 £34,000
25th Percentile £41,250 £40,000 £45,000
Median annual salary (50th Percentile) £57,443 £55,000 £60,899
Median % change year-on-year +4.44% -9.69% +1.50%
75th Percentile £75,000 £72,500 £81,250
90th Percentile £97,500 £92,500 £100,000
UK excluding London median annual salary £51,574 £50,000 £55,000
% change year-on-year +3.15% -9.09% +4.76%

Customer Engagement
Job Vacancy Trend

Job postings citing Customer Engagement as a proportion of all IT jobs advertised.
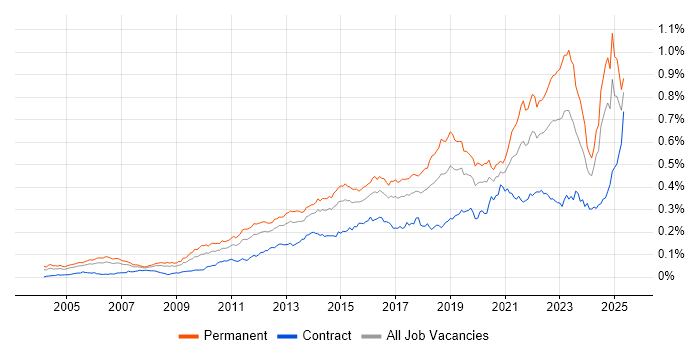
Job vacancy trend for Customer Engagement in the UK

Customer Engagement
Salary Trend

3-month moving average salary quoted in jobs citing Customer Engagement.

Salary trend for Customer Engagement in the UK

Customer Engagement
Salary Histogram

Salary distribution for jobs citing Customer Engagement over the 6 months to 30 May 2025.

Salary histogram for Customer Engagement in the UK

Customer Engagement
Top 17 Job Locations

The table below looks at the demand and provides a guide to the median salaries quoted in IT jobs citing Customer Engagement within the UK over the 6 months to 30 May 2025. The 'Rank Change' column provides an indication of the change in demand within each location based on the same 6 month period last year.

Location Rank Change
on Same Period
Last Year
Matching
Permanent
IT Job Ads
Median Salary
Past 6 Months
Median Salary
% Change
on Same Period
Last Year
Live
Jobs
England +119 413 £55,000 -4.35% 2,768
UK excluding London +187 341 £50,000 +8.11% 2,757
Work from Home +51 182 £60,000 +9.09% 1,501
London +89 109 £65,154 -18.05% 364
North of England +74 99 £54,793 +36.98% 585
South East +122 74 £47,500 -23.01% 806
Yorkshire +106 55 £54,793 -8.68% 251
Midlands +80 54 £50,000 -13.04% 534
South West +93 44 £66,367 +76.98% 317
North West -4 43 £61,250 +53.13% 270
Scotland +140 36 £60,743 +51.86% 105
West Midlands +53 35 £47,500 -17.39% 272
East of England +4 23 £32,500 -27.78% 394
East Midlands +45 19 £55,000 +15.79% 225
Wales +55 10 £45,000 -35.71% 70
North East +38 1 £52,500 +23.53% 65
Northern Ireland - 1 - - 38

Customer Engagement
Co-occurring Skills and Capabilities by Category

The follow tables expand on the table above by listing co-occurrences grouped by category. The same employment type, locality and period is covered with up to 20 co-occurrences shown in each of the following categories:

Application Platforms
1 15 (3.13%) CMS
2 6 (1.25%) Apache Spark
3 4 (0.83%) Confluence
3 4 (0.83%) Headless CMS
3 4 (0.83%) SharePoint
4 2 (0.42%) Adobe Experience Manager
4 2 (0.42%) SAS
4 2 (0.42%) WordPress
5 1 (0.21%) Apache Airflow
5 1 (0.21%) NetWeaver
Applications
1 22 (4.58%) Microsoft Office
2 8 (1.67%) Microsoft Excel
3 5 (1.04%) MS Visio
4 3 (0.63%) Microsoft Project
4 3 (0.63%) Trello
5 2 (0.42%) Adobe Creative Suite
5 2 (0.42%) Adobe Illustrator
5 2 (0.42%) InDesign
5 2 (0.42%) Photoshop
6 1 (0.21%) Chatbot
6 1 (0.21%) Spreadsheet
Business Applications
1 33 (6.88%) Dynamics CRM
2 9 (1.88%) Shopify
3 5 (1.04%) Oracle ERP
4 2 (0.42%) Magento
4 2 (0.42%) SAP S/4HANA
5 1 (0.21%) Raiser’s Edge
5 1 (0.21%) Remedy ITSM
5 1 (0.21%) SAP ERP
5 1 (0.21%) SAP FI
5 1 (0.21%) SAP FSCM
5 1 (0.21%) SAP HCM
5 1 (0.21%) SAP MDG
Cloud Services
1 65 (13.54%) Dynamics 365
2 45 (9.38%) Azure
3 37 (7.71%) Power Platform
4 29 (6.04%) SaaS
5 27 (5.63%) AWS
6 24 (5.00%) PowerApps
7 23 (4.79%) Power Automate
8 21 (4.38%) Google Analytics
9 12 (2.50%) Azure Logic Apps
10 10 (2.08%) GCP
11 8 (1.67%) Microsoft 365
12 7 (1.46%) Azure DevOps
13 6 (1.25%) Amazon EMR
13 6 (1.25%) Amazon SageMaker
13 6 (1.25%) Azure Functions
13 6 (1.25%) Serverless
13 6 (1.25%) Snowflake
14 5 (1.04%) Azure Service Bus
14 5 (1.04%) Cloud Computing
14 5 (1.04%) PaaS
Communications & Networking
1 5 (1.04%) SMS
2 3 (0.63%) DNS
2 3 (0.63%) Firewall
2 3 (0.63%) VoIP
2 3 (0.63%) WAN
3 2 (0.42%) 5G
3 2 (0.42%) LAN
3 2 (0.42%) SD-WAN
3 2 (0.42%) TCP/IP
3 2 (0.42%) VPN
4 1 (0.21%) DHCP
4 1 (0.21%) Intelligent Network
4 1 (0.21%) Intrusion Detection
4 1 (0.21%) NAS
4 1 (0.21%) Network Security
4 1 (0.21%) SAN
4 1 (0.21%) Software-Defined Networking
4 1 (0.21%) SpaceWire
4 1 (0.21%) SSL
4 1 (0.21%) Unified Communications
Database & Business Intelligence
1 21 (4.38%) Power BI
2 16 (3.33%) Tableau
3 14 (2.92%) SQL Server Integration Services
4 10 (2.08%) SQL Server
5 4 (0.83%) KDB
5 4 (0.83%) Kdb+
6 3 (0.63%) SQL Server Reporting Services
7 2 (0.42%) Metadata
7 2 (0.42%) Relational Database
7 2 (0.42%) SAP HANA
8 1 (0.21%) Apache Cassandra
8 1 (0.21%) Big Data
8 1 (0.21%) Data Mining
8 1 (0.21%) Data Warehouse
8 1 (0.21%) DynamoDB
8 1 (0.21%) Elasticsearch
8 1 (0.21%) Hadoop
8 1 (0.21%) NoSQL
8 1 (0.21%) Oracle Reports
8 1 (0.21%) SAP Data Services
Development Applications
1 11 (2.29%) JIRA
2 4 (0.83%) SQL Server Management Studio (SSMS)
2 4 (0.83%) Visual Studio
3 3 (0.63%) Selenium
4 1 (0.21%) Git
4 1 (0.21%) GitLab
4 1 (0.21%) MLflow
4 1 (0.21%) Team Foundation Server
General
1 196 (40.83%) Social Skills
2 119 (24.79%) Marketing
3 95 (19.79%) Finance
4 60 (12.50%) Analytical Skills
5 50 (10.42%) Inclusion and Diversity
6 42 (8.75%) Presentation Skills
7 28 (5.83%) Law
8 27 (5.63%) Legal
9 23 (4.79%) Retail
10 18 (3.75%) Banking
11 17 (3.54%) Advertising
12 16 (3.33%) Organisational Skills
13 14 (2.92%) Electronics
14 11 (2.29%) Publishing
15 10 (2.08%) Automotive
15 10 (2.08%) Public Sector
16 9 (1.88%) Billing
17 8 (1.67%) Brand Awareness
18 7 (1.46%) Influencing Skills
19 6 (1.25%) Games
Job Titles
1 116 (24.17%) Engineering Manager
2 40 (8.33%) Lead
3 37 (7.71%) Cisco Specialist
4 36 (7.50%) Architect
5 31 (6.46%) Senior
6 27 (5.63%) Developer
7 26 (5.42%) Analyst
8 21 (4.38%) Product Manager
9 19 (3.96%) Solutions Architect
10 17 (3.54%) Consultant
11 16 (3.33%) Dynamics 365 Developer
11 16 (3.33%) IT Support
11 16 (3.33%) Marketing Manager
12 15 (3.13%) Project Manager
13 13 (2.71%) Product Marketing Manager
13 13 (2.71%) Sales Manager
14 12 (2.50%) Product Owner
15 11 (2.29%) CRM Developer
16 9 (1.88%) Dynamics 365 Architect
16 9 (1.88%) Operations Project Manager
Libraries, Frameworks & Software Standards
1 18 (3.75%) .NET
2 16 (3.33%) HTML
3 15 (3.13%) CSS
4 8 (1.67%) .NET Framework
5 6 (1.25%) Kafka
6 4 (0.83%) Django
6 4 (0.83%) Express.js
6 4 (0.83%) Flask
6 4 (0.83%) JSON
6 4 (0.83%) MACH
6 4 (0.83%) Next.js
6 4 (0.83%) Node.js
6 4 (0.83%) React
7 2 (0.42%) Playwright
7 2 (0.42%) SAP Fiori
7 2 (0.42%) SOAP
7 2 (0.42%) XML
8 1 (0.21%) PyTorch
8 1 (0.21%) REST
8 1 (0.21%) TensorFlow
Miscellaneous
1 24 (5.00%) Product Ownership
2 21 (4.38%) Social Media
3 18 (3.75%) GNSS
4 15 (3.13%) Onboarding
5 13 (2.71%) Analytical Mindset
6 12 (2.50%) Self-Motivation
7 8 (1.67%) Marketing Technology
8 5 (1.04%) Data Centre
9 4 (0.83%) Blog
9 4 (0.83%) Hackathon
10 3 (0.63%) Cyber Defence
10 3 (0.63%) Legacy Systems
10 3 (0.63%) Low-Code
10 3 (0.63%) Mobile App
11 2 (0.42%) Embedded Systems
11 2 (0.42%) PropTech
12 1 (0.21%) Digital Wallet
12 1 (0.21%) Security Posture
12 1 (0.21%) Self-Driving Car
12 1 (0.21%) Team-Oriented Environment
Operating Systems
1 6 (1.25%) Windows
2 4 (0.83%) Linux
2 4 (0.83%) Mac OS
3 2 (0.42%) Android
3 2 (0.42%) Apple iOS
4 1 (0.21%) Unix
Processes & Methodologies
1 116 (24.17%) Model-Based Systems Engineering
1 116 (24.17%) Systems Engineering
2 94 (19.58%) CRM
3 79 (16.46%) Agile
4 66 (13.75%) Problem-Solving
5 58 (12.08%) Project Management
6 57 (11.88%) Analytics
7 56 (11.67%) B2B
8 53 (11.04%) Decision-Making
9 48 (10.00%) Digital Marketing
10 46 (9.58%) Artificial Intelligence
11 44 (9.17%) Customer Service
12 40 (8.33%) Mentoring
13 36 (7.50%) Continuous Improvement
13 36 (7.50%) Marketing Strategy
14 35 (7.29%) Collaborative Culture
15 34 (7.08%) Business Development
16 33 (6.88%) Customer Experience
16 33 (6.88%) Stakeholder Management
17 31 (6.46%) Roadmaps
Programming Languages
1 36 (7.50%) C#
2 29 (6.04%) Python
3 28 (5.83%) JavaScript
4 27 (5.63%) SQL
5 8 (1.67%) R
6 7 (1.46%) C
7 4 (0.83%) X++
8 3 (0.63%) Go
9 2 (0.42%) C++
9 2 (0.42%) Java
9 2 (0.42%) MATLAB
9 2 (0.42%) PowerShell
10 1 (0.21%) ABAP
10 1 (0.21%) Apex Code
10 1 (0.21%) Data Analysis Expressions
10 1 (0.21%) PHP
10 1 (0.21%) Shell Script
10 1 (0.21%) TypeScript
Qualifications
1 170 (35.42%) Degree
2 129 (26.88%) Master's Degree
3 125 (26.04%) BPSS Clearance
4 116 (24.17%) Chartered Engineer
5 14 (2.92%) Security Cleared
6 11 (2.29%) SC Cleared
7 8 (1.67%) AWS Certification
7 8 (1.67%) AWS Certified Cloud Practitioner
8 7 (1.46%) MBA
9 6 (1.25%) Microsoft Certification
9 6 (1.25%) PMI Certification
9 6 (1.25%) PMP
10 5 (1.04%) Cisco Certification
11 4 (0.83%) Azure Certification
11 4 (0.83%) CISSP
11 4 (0.83%) ISTQB
11 4 (0.83%) ISTQB Foundation Certification
12 3 (0.63%) (ISC)2 CCSP
12 3 (0.63%) CCSP
12 3 (0.63%) CISM
Quality Assurance & Compliance
1 19 (3.96%) PMO
2 12 (2.50%) GDPR
2 12 (2.50%) QA
3 6 (1.25%) California Consumer Privacy Act
3 6 (1.25%) PCI DSS
4 4 (0.83%) Data Quality
4 4 (0.83%) ISO/IEC 27001
5 3 (0.63%) Accessibility
5 3 (0.63%) Actionable Recommendations
5 3 (0.63%) GRC
5 3 (0.63%) NIST
6 2 (0.42%) SLA
7 1 (0.21%) ECSS
7 1 (0.21%) ISO 9001
7 1 (0.21%) MiFID
7 1 (0.21%) PSD2
7 1 (0.21%) Sarbanes-Oxley
System Software
1 11 (2.29%) Docker
2 1 (0.21%) Active Directory
2 1 (0.21%) Snort
2 1 (0.21%) Virtual Machines
2 1 (0.21%) VMware Infrastructure
2 1 (0.21%) VMware NSX
2 1 (0.21%) vSphere
Systems Management
1 10 (2.08%) Kubernetes
2 2 (0.42%) Ansible
2 2 (0.42%) Microsoft Intune
3 1 (0.21%) HP UCMDB
3 1 (0.21%) Terraform
3 1 (0.21%) vCenter Server
Vendors
1 81 (16.88%) Microsoft
2 41 (8.54%) Cisco
3 27 (5.63%) Salesforce
4 24 (5.00%) Google
5 18 (3.75%) Oracle
6 8 (1.67%) HubSpot
6 8 (1.67%) SAP
7 6 (1.25%) Facebook
7 6 (1.25%) ServiceNow
8 5 (1.04%) Adobe
8 5 (1.04%) PeopleSoft
8 5 (1.04%) Salesforce Marketing Cloud
9 4 (0.83%) Dell
10 3 (0.63%) Databricks
10 3 (0.63%) IBM
10 3 (0.63%) Instagram
10 3 (0.63%) Splunk
10 3 (0.63%) VMware
11 2 (0.42%) Fortinet
11 2 (0.42%) WooCommerce