Documentation Skills
UK

The table below looks at the prevalence of the term Documentation Skills in permanent job vacancies. Included is a benchmarking guide to the salaries offered in vacancies that have cited Documentation Skills over the 6 months to 4 December 2023 with a comparison to the same period over the previous 2 years.

6 months to
4 Dec 2023
Same period 2022 Same period 2021
Rank 433 500 480
Rank change year-on-year +67 -20 -61
Permanent jobs citing Documentation Skills 334 736 848
As % of all permanent jobs advertised in the UK 0.63% 0.59% 0.66%
As % of the General category 0.95% 0.86% 1.10%
Number of salaries quoted 286 514 594
10th Percentile £31,750 £36,250 £35,000
25th Percentile £42,500 £45,000 £45,000
Median annual salary (50th Percentile) £55,000 £60,000 £55,000
Median % change year-on-year -8.33% +9.09% +10.00%
75th Percentile £79,688 £73,750 £71,250
90th Percentile £90,000 £85,000 £87,500
UK excluding London median annual salary £47,500 £55,000 £50,000
% change year-on-year -13.64% +10.00% +13.64%

All General Skills
UK

Documentation Skills is in the General Skills category. The following table is for comparison with the above and provides summary statistics for all permanent job vacancies with a requirement for common skills.

Permanent vacancies with a requirement for common skills 34,987 85,326 76,824
As % of all permanent jobs advertised in the UK 65.72% 68.84% 59.90%
Number of salaries quoted 24,523 48,276 47,746
10th Percentile £30,500 £32,500 £31,500
25th Percentile £42,500 £45,000 £42,250
Median annual salary (50th Percentile) £60,000 £60,000 £57,500
Median % change year-on-year - +4.35% +4.55%
75th Percentile £80,000 £82,500 £78,750
90th Percentile £100,000 £100,000 £97,500
UK excluding London median annual salary £50,000 £52,500 £49,350
% change year-on-year -4.76% +6.38% +3.89%

Documentation Skills
Job Vacancy Trend

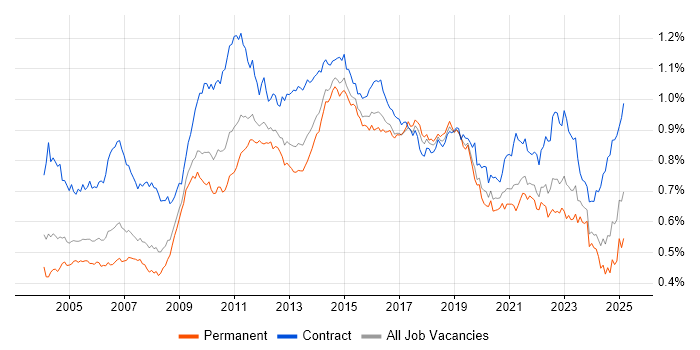
Job postings citing Documentation Skills as a proportion of all IT jobs advertised.

Job vacancy trend for Documentation Skills in the UK

Documentation Skills
Salary Trend

3-month moving average salary quoted in jobs citing Documentation Skills.

Salary trend for Documentation Skills in the UK

Documentation Skills
Salary Histogram

Salary distribution for jobs citing Documentation Skills over the 6 months to 4 December 2023.

Salary histogram for Documentation Skills in the UK

Documentation Skills
Top 17 Job Locations

The table below looks at the demand and provides a guide to the median salaries quoted in IT jobs citing Documentation Skills within the UK over the 6 months to 4 December 2023. The 'Rank Change' column provides an indication of the change in demand within each location based on the same 6 month period last year.

Location Rank Change
on Same Period
Last Year
Matching
Permanent
IT Job Ads
Median Salary
Past 6 Months
Median Salary
% Change
on Same Period
Last Year
Live
Jobs
England +95 314 £55,000 -4.35% 191
UK excluding London +80 176 £47,500 -13.64% 131
London +106 132 £77,500 +14.81% 59
Work from Home +83 124 £52,500 -8.70% 109
South East +134 74 £50,000 -4.76% 36
North of England +100 27 £33,500 -33.00% 35
Midlands +77 24 £50,000 -4.76% 25
South West +66 22 £47,500 -20.83% 20
North West +65 21 £33,500 -34.31% 22
East of England +121 20 £47,500 +26.67% 14
West Midlands +91 14 £50,000 -4.76% 17
East Midlands +40 10 £52,500 -4.55% 8
Scotland +20 7 £39,774 -38.81% 6
Yorkshire +75 5 £45,000 -4.26% 5
North East +50 1 - - 8
Wales +12 1 £32,500 -18.75%
Northern Ireland - 1 - - 2

Documentation Skills
Co-occurring Skills and Capabilities by Category

The follow tables expand on the table above by listing co-occurrences grouped by category. The same employment type, locality and period is covered with up to 20 co-occurrences shown in each of the following categories:

Application Platforms
1 18 (5.39%) SharePoint
2 9 (2.69%) IIS
3 5 (1.50%) MS Exchange
4 4 (1.20%) Apache
4 4 (1.20%) OpenStack
5 3 (0.90%) Confluence
6 1 (0.30%) Apache Spark
6 1 (0.30%) Exchange Server 2007
6 1 (0.30%) MS Project Server
6 1 (0.30%) SharePoint Server
6 1 (0.30%) Skype for Business
Applications
1 32 (9.58%) Microsoft Office
2 18 (5.39%) Microsoft Excel
2 18 (5.39%) Microsoft Project
3 12 (3.59%) Microsoft PowerPoint
4 7 (2.10%) MS Visio
5 4 (1.20%) CANalyzer
5 4 (1.20%) Simulink
5 4 (1.20%) Stateflow
6 2 (0.60%) Mathcad
7 1 (0.30%) Acrobat
Business Applications
1 4 (1.20%) SAP S/4HANA
2 3 (0.90%) SAP BPC
3 2 (0.60%) SAP FSCM
3 2 (0.60%) SAP MDG
4 1 (0.30%) Dynamics CRM
4 1 (0.30%) JDE EnterpriseOne
4 1 (0.30%) Oracle Financials
4 1 (0.30%) SAP CRM
4 1 (0.30%) SAP CX
4 1 (0.30%) SAP ERP
4 1 (0.30%) SAP SEM
Cloud Services
1 90 (26.95%) Azure
2 69 (20.66%) Microsoft 365
3 35 (10.48%) Power Platform
4 26 (7.78%) Entra ID
5 21 (6.29%) SaaS
6 20 (5.99%) AWS
7 16 (4.79%) PowerApps
8 10 (2.99%) Azure DevOps
9 9 (2.69%) GCP
10 8 (2.40%) OneDrive
11 7 (2.10%) Cloud Computing
11 7 (2.10%) PaaS
12 6 (1.80%) IaaS
13 5 (1.50%) AWS CloudFormation
13 5 (1.50%) GitHub
14 4 (1.20%) Azure Sentinel
15 3 (0.90%) Amazon CloudWatch
15 3 (0.90%) AWS Lambda
15 3 (0.90%) Serverless
15 3 (0.90%) WhatsApp
Communications & Networking
1 42 (12.57%) Firewall
2 30 (8.98%) Wi-Fi
3 29 (8.68%) Wireless
4 25 (7.49%) WAN
5 19 (5.69%) VoIP
6 17 (5.09%) LAN
7 16 (4.79%) Network Security
7 16 (4.79%) SD-WAN
8 15 (4.49%) VPN
9 13 (3.89%) DNS
10 12 (3.59%) SAN
11 11 (3.29%) DHCP
11 11 (3.29%) Remote Desktop
12 10 (2.99%) BGP
12 10 (2.99%) TCP/IP
13 8 (2.40%) Internet
13 8 (2.40%) OSPF
14 7 (2.10%) VLAN
15 6 (1.80%) J1939
15 6 (1.80%) MPLS
Database & Business Intelligence
1 39 (11.68%) SQL Server
2 30 (8.98%) Power BI
3 18 (5.39%) SQL Server Integration Services
3 18 (5.39%) SQL Server Reporting Services
4 16 (4.79%) Relational Database
5 15 (4.49%) Data Warehouse
6 13 (3.89%) SQL Server Analysis Services
7 8 (2.40%) MySQL
8 6 (1.80%) Star Schema
9 5 (1.50%) BigQuery
9 5 (1.50%) Hadoop
10 4 (1.20%) Amazon RDS
11 3 (0.90%) Data Hub
11 3 (0.90%) Metadata
11 3 (0.90%) MongoDB
11 3 (0.90%) NoSQL
11 3 (0.90%) PostgreSQL
12 2 (0.60%) Azure SQL Data Warehouse
12 2 (0.60%) Azure SQL Database
12 2 (0.60%) RDBMS
Development Applications
1 14 (4.19%) JIRA
2 7 (2.10%) Jenkins
3 6 (1.80%) Git
4 4 (1.20%) Selenium
4 4 (1.20%) Team Foundation Server
4 4 (1.20%) TeamCity
5 3 (0.90%) Cypress.io
5 3 (0.90%) SQL Server Management Studio (SSMS)
5 3 (0.90%) Visual Studio
6 2 (0.60%) Burp Suite
6 2 (0.60%) Gradle
6 2 (0.60%) LSMW
6 2 (0.60%) Maven
6 2 (0.60%) Sonatype Nexus
6 2 (0.60%) SpecFlow
7 1 (0.30%) ERwin
7 1 (0.30%) git-flow
7 1 (0.30%) Octopus Deploy
7 1 (0.30%) Visual Studio Code
7 1 (0.30%) Visual Studio Team System
General
1 181 (54.19%) Social Skills
2 87 (26.05%) Finance
3 31 (9.28%) Telecoms
4 27 (8.08%) Banking
5 25 (7.49%) Analytical Skills
6 20 (5.99%) Presentation Skills
7 14 (4.19%) Public Sector
7 14 (4.19%) Retail
8 13 (3.89%) Organisational Skills
9 10 (2.99%) Marketing
10 9 (2.69%) Manufacturing
11 8 (2.40%) Inclusion and Diversity
12 7 (2.10%) Back Office
12 7 (2.10%) Law
13 5 (1.50%) Retail Banking
14 4 (1.20%) Automotive
14 4 (1.20%) Legal
15 3 (0.90%) Fire and Rescue
15 3 (0.90%) Games
15 3 (0.90%) Local Government
Job Titles
1 69 (20.66%) Analyst
2 38 (11.38%) IT Manager
3 36 (10.78%) Business Analyst
4 35 (10.48%) Developer
5 31 (9.28%) Senior
6 26 (7.78%) Project Manager
7 24 (7.19%) Insurance Business Analyst
8 23 (6.89%) IT Project Manager
9 21 (6.29%) Lead
10 19 (5.69%) Implementation Analyst
10 19 (5.69%) IT Engineer
10 19 (5.69%) Network Engineer
10 19 (5.69%) Software Analyst
10 19 (5.69%) Software Implementation Analyst
11 15 (4.49%) Business Intelligence Developer
11 15 (4.49%) Infrastructure Manager
11 15 (4.49%) IT Support
11 15 (4.49%) Support Engineer
12 14 (4.19%) IT Infrastructure Manager
12 14 (4.19%) Power BI Developer
Libraries, Frameworks & Software Standards
1 16 (4.79%) .NET
2 9 (2.69%) CSS
2 9 (2.69%) React
3 7 (2.10%) XML
4 6 (1.80%) ADO
4 6 (1.80%) AngularJS
4 6 (1.80%) HTML
5 5 (1.50%) Node.js
6 4 (1.20%) JSON
6 4 (1.20%) LDAP
6 4 (1.20%) Next.js
6 4 (1.20%) Twitter Bootstrap
6 4 (1.20%) Vue
6 4 (1.20%) YAML
7 3 (0.90%) FHIR
7 3 (0.90%) GraphQL
7 3 (0.90%) React Native
7 3 (0.90%) Sass
7 3 (0.90%) Tailwind CSS
8 2 (0.60%) .NET Core
Miscellaneous
1 35 (10.48%) Self-Motivation
2 28 (8.38%) Data Centre
3 26 (7.78%) Management Information System
4 19 (5.69%) Reinsurance
5 18 (5.39%) Driving Licence
6 8 (2.40%) Data Structures
6 8 (2.40%) Mobile App
7 7 (2.10%) Replication
8 6 (1.80%) Clustering
8 6 (1.80%) Embedded Systems
8 6 (1.80%) Public Cloud
9 5 (1.50%) FMCG
9 5 (1.50%) Video Conferencing
10 4 (1.20%) Algorithms
10 4 (1.20%) PKI
11 3 (0.90%) Cloud Native
11 3 (0.90%) NHS
11 3 (0.90%) Onboarding
12 2 (0.60%) Distributed Architecture
12 2 (0.60%) Security Posture
Operating Systems
1 70 (20.96%) Windows
2 34 (10.18%) Windows Server
3 26 (7.78%) Linux
4 13 (3.89%) Windows Server 2016
5 12 (3.59%) Windows 10
6 11 (3.29%) AIX
6 11 (3.29%) Windows Server 2019
7 7 (2.10%) Unix
8 6 (1.80%) Windows 7
9 4 (1.20%) Ubuntu
10 3 (0.90%) Apple iOS
10 3 (0.90%) Windows Server 2012
11 2 (0.60%) Android
11 2 (0.60%) Mac OS
11 2 (0.60%) Red Hat Enterprise Linux
12 1 (0.30%) CentOS
12 1 (0.30%) Mac OS X
12 1 (0.30%) Solaris
12 1 (0.30%) VMS
12 1 (0.30%) Windows Server 2008
Processes & Methodologies
1 96 (28.74%) Problem-Solving
2 95 (28.44%) Agile
3 59 (17.66%) Project Delivery
4 46 (13.77%) Project Management
5 41 (12.28%) ITIL
6 39 (11.68%) Stakeholder Management
7 34 (10.18%) Business Analysis
8 32 (9.58%) Migration
8 32 (9.58%) Waterfall
9 30 (8.98%) DevOps
10 29 (8.68%) Business Intelligence
11 27 (8.08%) Decision-Making
11 27 (8.08%) Roadmaps
12 25 (7.49%) Analytics
13 24 (7.19%) Mentoring
14 23 (6.89%) Customer Service
14 23 (6.89%) Infrastructure Engineering
14 23 (6.89%) Knowledge Transfer
15 22 (6.59%) Data Modelling
15 22 (6.59%) SDLC
Programming Languages
1 72 (21.56%) SQL
2 40 (11.98%) PowerShell
3 22 (6.59%) Python
4 16 (4.79%) JavaScript
5 13 (3.89%) C#
5 13 (3.89%) Data Analysis Expressions
6 10 (2.99%) Java
6 10 (2.99%) T-SQL
7 8 (2.40%) PHP
8 7 (2.10%) Bash
9 6 (1.80%) MATLAB
10 4 (1.20%) C++
11 3 (0.90%) Go
11 3 (0.90%) Kusto Query Language
11 3 (0.90%) Shell Script
12 2 (0.60%) C
12 2 (0.60%) Delphi
12 2 (0.60%) Groovy
12 2 (0.60%) Ruby
12 2 (0.60%) Rust
Qualifications
1 62 (18.56%) Degree
2 22 (6.59%) Security Cleared
3 16 (4.79%) SC Cleared
4 15 (4.49%) Cisco Certification
4 15 (4.49%) Computer Science Degree
5 8 (2.40%) ITIL Certification
6 6 (1.80%) CCNP
6 6 (1.80%) Microsoft Certification
7 5 (1.50%) Azure Certification
7 5 (1.50%) CCIE
7 5 (1.50%) CCNA
7 5 (1.50%) MCSA
8 4 (1.20%) AWS Certification
8 4 (1.20%) DV Cleared
8 4 (1.20%) RIBA
9 3 (0.90%) CCSP
9 3 (0.90%) CISMP
9 3 (0.90%) GSEC
9 3 (0.90%) JNCIP
9 3 (0.90%) SSCP
Quality Assurance & Compliance
1 19 (5.69%) Cyber Essentials
1 19 (5.69%) QA
2 13 (3.89%) ISO/IEC 27001
3 10 (2.99%) Data Quality
4 9 (2.69%) SLA
5 7 (2.10%) NCSC
6 5 (1.50%) PCI DSS
7 4 (1.20%) Automotive SPICE
7 4 (1.20%) ISO 26262
7 4 (1.20%) NIST
7 4 (1.20%) PMO
8 3 (0.90%) DICOM
8 3 (0.90%) HL7
9 2 (0.60%) GDPR
9 2 (0.60%) IFRS
9 2 (0.60%) ISO 9001
9 2 (0.60%) ISO/IEC 27002 (supersedes ISO/IEC 17799)
10 1 (0.30%) Cyber Essentials PLUS
10 1 (0.30%) HIPAA
System Software
1 65 (19.46%) Active Directory
2 31 (9.28%) VMware Infrastructure
3 16 (4.79%) Hyper-V
4 13 (3.89%) vSphere
5 12 (3.59%) Virtual Desktop
6 7 (2.10%) Docker
7 5 (1.50%) Virtual Servers
7 5 (1.50%) VMware ESXi
8 3 (0.90%) Ceph
8 3 (0.90%) KVM
9 2 (0.60%) Firmware
9 2 (0.60%) VMware NSX
10 1 (0.30%) Microsoft Virtual Server
10 1 (0.30%) NFS
10 1 (0.30%) Virtual Machines
Systems Management
1 27 (8.08%) SCCM
2 25 (7.49%) Microsoft Intune
3 15 (4.49%) Ansible
4 10 (2.99%) Kubernetes
4 10 (2.99%) Terraform
5 6 (1.80%) AirWatch
6 5 (1.50%) Failover Clustering
7 4 (1.20%) FortiGate
8 3 (0.90%) SCOM
8 3 (0.90%) Single Sign-On
9 2 (0.60%) Active Directory Federation Services
9 2 (0.60%) Jamf Pro
10 1 (0.30%) Cisco CUCM
10 1 (0.30%) Cisco UCCX
10 1 (0.30%) Foglight
10 1 (0.30%) Microsoft Clustering
10 1 (0.30%) Packer
10 1 (0.30%) ZABBIX
Vendors
1 117 (35.03%) Microsoft
2 40 (11.98%) VMware
3 32 (9.58%) Cisco
4 21 (6.29%) HP
5 19 (5.69%) Oracle
6 14 (4.19%) Fortinet
7 13 (3.89%) Veeam
8 10 (2.99%) Aruba
8 10 (2.99%) Google
8 10 (2.99%) Salesforce
9 9 (2.69%) Dell
9 9 (2.69%) ServiceNow
10 8 (2.40%) Symantec
11 7 (2.10%) Apple
11 7 (2.10%) Arista
11 7 (2.10%) Citrix
11 7 (2.10%) ConnectWise
11 7 (2.10%) Draytek
11 7 (2.10%) SAP
11 7 (2.10%) Ubiquiti