(ISC)² Certified Information Systems Security Professional (ISC2 CISSP)
UK

The table below provides summary statistics for permanent job vacancies with a requirement for CISSP qualifications. It includes a benchmarking guide to the salaries offered over the 6 months leading up to 26 July 2024, comparing them to the same period in the previous two years.

6 months to
26 Jul 2024
Same period 2023 Same period 2022
Rank 261 258 379
Rank change year-on-year -3 +121 -19
Permanent jobs citing CISSP 950 1,143 1,729
As % of all permanent jobs advertised in the UK 1.05% 1.42% 0.99%
As % of the Qualifications category 4.00% 4.20% 3.54%
Number of salaries quoted 693 826 1,121
10th Percentile £45,000 £45,000 £43,000
25th Percentile £55,000 £55,000 £55,000
Median annual salary (50th Percentile) £70,000 £70,000 £70,000
Median % change year-on-year - - +7.69%
75th Percentile £88,500 £87,500 £85,000
90th Percentile £100,000 £104,375 £100,000
UK excluding London median annual salary £60,000 £64,750 £63,588
% change year-on-year -7.34% +1.83% +4.86%

All Academic and Professional Certifications
UK

CISSP falls under the Academic Qualifications and Professional Certifications category. For comparison with the information above, the following table provides summary statistics for all permanent job vacancies requiring academic qualifications or professional certifications.

Permanent vacancies requiring academic qualifications or professional certifications 23,768 27,219 48,854
As % of all permanent jobs advertised in the UK 26.30% 33.73% 27.87%
Number of salaries quoted 13,396 13,767 20,158
10th Percentile £30,000 £32,000 £30,500
25th Percentile £40,000 £42,500 £40,000
Median annual salary (50th Percentile) £55,000 £60,000 £55,000
Median % change year-on-year -8.33% +9.09% -
75th Percentile £72,425 £76,250 £73,750
90th Percentile £88,500 £95,000 £91,250
UK excluding London median annual salary £50,000 £52,500 £48,500
% change year-on-year -4.76% +8.25% +2.11%

CISSP
Job Vacancy Trend

Job postings citing CISSP as a proportion of all IT jobs advertised.
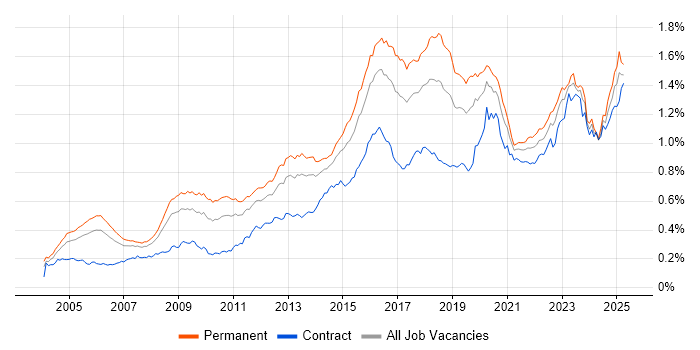
Job vacancy trend for CISSP in the UK

CISSP
Salary Trend

3-month moving average salary quoted in jobs citing CISSP.

Salary trend for CISSP in the UK

CISSP
Salary Histogram

Salary distribution for jobs citing CISSP over the 6 months to 26 July 2024.

Salary histogram for CISSP in the UK

CISSP
Top 17 Job Locations

The table below looks at the demand and provides a guide to the median salaries quoted in IT jobs citing CISSP within the UK over the 6 months to 26 July 2024. The 'Rank Change' column provides an indication of the change in demand within each location based on the same 6 month period last year.

Location Rank Change
on Same Period
Last Year
Matching
Permanent
IT Job Ads
Median Salary
Past 6 Months
Median Salary
% Change
on Same Period
Last Year
Live
Jobs
England +3 867 £70,000 - 97
UK excluding London -25 493 £60,000 -7.34% 75
London +27 410 £85,000 +6.25% 43
Work from Home -78 297 £70,000 - 64
North of England +48 149 £55,000 -15.38% 20
South West -13 106 £68,500 +1.48% 8
North West +34 105 £55,000 +11.11% 13
South East -31 98 £57,500 -2.95% 13
Midlands -50 75 £68,578 +19.27% 11
West Midlands -47 51 £70,000 +21.74% 9
Scotland -39 38 £64,100 -1.18% 8
Yorkshire +53 37 £79,842 +17.41% 3
East Midlands -14 23 £66,500 +15.65% 2
East of England -18 20 £45,000 -35.71% 6
North East -7 7 £64,921 -7.26% 4
Isle of Man -15 4 £46,500 -20.85%
Wales +13 3 £68,750 +34.80% 2

CISSP
Co-occurring Skills and Capabilities by Category

The follow tables expand on the table above by listing co-occurrences grouped by category. The same employment type, locality and period is covered with up to 20 co-occurrences shown in each of the following categories:

Application Platforms
1 6 (0.63%) SharePoint
2 1 (0.11%) Apache
2 1 (0.11%) CMS
2 1 (0.11%) Confluence
2 1 (0.11%) Microsoft Exchange
2 1 (0.11%) nginx
2 1 (0.11%) SAS
2 1 (0.11%) Umbraco
Applications
1 16 (1.68%) Microsoft Office
2 13 (1.37%) Microsoft Excel
3 3 (0.32%) Microsoft PowerPoint
4 2 (0.21%) MS Visio
Business Applications
1 15 (1.58%) Ripple
2 1 (0.11%) Maximo
2 1 (0.11%) Payment Gateway
Cloud Services
1 251 (26.42%) Azure
2 183 (19.26%) AWS
3 95 (10.00%) Microsoft 365
4 48 (5.05%) GCP
5 40 (4.21%) Cloud Computing
6 32 (3.37%) Azure Sentinel
7 26 (2.74%) SaaS
8 20 (2.11%) Power Platform
9 16 (1.68%) IaaS
9 16 (1.68%) PaaS
10 12 (1.26%) Entra ID
11 10 (1.05%) Microsoft Purview
12 7 (0.74%) Snowflake
12 7 (0.74%) WhatsApp
13 4 (0.42%) Amazon S3
14 3 (0.32%) Mimecast
14 3 (0.32%) OneDrive
14 3 (0.32%) SuccessFactors
15 2 (0.21%) AWS Lambda
15 2 (0.21%) Azure Service Fabric
Communications & Networking
1 219 (23.05%) Firewall
2 135 (14.21%) Network Security
3 57 (6.00%) VPN
4 52 (5.47%) Intrusion Detection
5 46 (4.84%) WAN
6 34 (3.58%) LAN
7 32 (3.37%) TCP/IP
8 29 (3.05%) SD-WAN
9 22 (2.32%) Wi-Fi
10 20 (2.11%) DNS
11 17 (1.79%) Internet
11 17 (1.79%) VoIP
12 16 (1.68%) Cisco IOS
13 10 (1.05%) Cisco IPT
13 10 (1.05%) Cisco Nexus
14 8 (0.84%) BGP
14 8 (0.84%) OSPF
15 7 (0.74%) IPsec
16 6 (0.63%) BIG-IP
16 6 (0.63%) HSRP
Database & Business Intelligence
1 19 (2.00%) Power BI
2 5 (0.53%) Elasticsearch
2 5 (0.53%) NoSQL
2 5 (0.53%) Redis
2 5 (0.53%) SQL Server
3 4 (0.42%) Big Data
4 2 (0.21%) Azure SQL Database
4 2 (0.21%) Data Warehouse
5 1 (0.11%) Amazon RDS
Development Applications
1 16 (1.68%) Jenkins
2 15 (1.58%) Artifactory
2 15 (1.58%) Git
3 4 (0.42%) JIRA
4 1 (0.11%) Ant
4 1 (0.11%) Burp Suite
4 1 (0.11%) Metasploit
General
1 289 (30.42%) Finance
2 234 (24.63%) Social Skills
3 108 (11.37%) Analytical Skills
4 99 (10.42%) Law
5 69 (7.26%) Legal
6 68 (7.16%) Inclusion and Diversity
7 46 (4.84%) Public Sector
8 39 (4.11%) Banking
9 37 (3.89%) Military
10 35 (3.68%) Presentation Skills
10 35 (3.68%) Telecoms
11 29 (3.05%) Retail
12 23 (2.42%) Influencing Skills
12 23 (2.42%) Marketing
13 22 (2.32%) Manufacturing
14 20 (2.11%) Financial Institution
15 14 (1.47%) Documentation Skills
16 8 (0.84%) Electronics
17 7 (0.74%) Advertising
18 6 (0.63%) Aerospace
Job Titles
1 169 (17.79%) Analyst
2 160 (16.84%) Architect
3 152 (16.00%) Senior
4 127 (13.37%) Security Analyst
5 120 (12.63%) Security Architect
5 120 (12.63%) Security Manager
6 111 (11.68%) Security Engineer
7 97 (10.21%) Consultant
8 96 (10.11%) Lead
9 91 (9.58%) Security Consultant
10 67 (7.05%) Information Security Manager
11 66 (6.95%) Information Manager
12 53 (5.58%) Senior Analyst
13 44 (4.63%) Senior Security Engineer
14 42 (4.42%) Cybersecurity Analyst
14 42 (4.42%) Senior Security Analyst
15 41 (4.32%) Cybersecurity Architect
16 40 (4.21%) Lead Architect
17 39 (4.11%) Cybersecurity Engineer
18 38 (4.00%) Information Security Analyst
Libraries, Frameworks & Software Standards
1 15 (1.58%) HTML
1 15 (1.58%) OAuth
2 14 (1.47%) SAML
3 10 (1.05%) ModSecurity
3 10 (1.05%) Web Services
4 7 (0.74%) SailPoint
5 6 (0.63%) 802.1X
5 6 (0.63%) Elastic Stack
6 5 (0.53%) Middleware
6 5 (0.53%) REST
7 4 (0.42%) Kafka
8 3 (0.32%) OpenID
8 3 (0.32%) web3js
9 2 (0.21%) .NET
9 2 (0.21%) EDI
9 2 (0.21%) LDAP
9 2 (0.21%) Microsoft Graph
9 2 (0.21%) SOAP
10 1 (0.11%) AngularJS
10 1 (0.11%) Vue
Miscellaneous
1 256 (26.95%) Management Information System
2 115 (12.11%) Security Posture
3 81 (8.53%) Cyber Threat
4 53 (5.58%) Security Operations Centre
5 52 (5.47%) Data Centre
6 47 (4.95%) Cyberattack
7 40 (4.21%) Distributed Denial-of-Service
8 38 (4.00%) Public Cloud
9 36 (3.79%) Product Ownership
10 35 (3.68%) Self-Motivation
11 31 (3.26%) Operational Technology
12 25 (2.63%) Onboarding
13 20 (2.11%) PKI
14 19 (2.00%) Data Protection Act
15 18 (1.89%) Blockchain
15 18 (1.89%) Cloud Native
16 16 (1.68%) Cyber Defence
16 16 (1.68%) Cyber Security Posture
17 15 (1.58%) Client/Server
18 11 (1.16%) Cloud Security Posture
Operating Systems
1 64 (6.74%) Windows
2 36 (3.79%) Linux
3 12 (1.26%) Unix
4 8 (0.84%) Windows Server
5 5 (0.53%) Kali Linux
5 5 (0.53%) Mac OS X
6 4 (0.42%) CentOS
6 4 (0.42%) Solaris
6 4 (0.42%) Ubuntu
6 4 (0.42%) zOS
7 2 (0.21%) Mac OS
7 2 (0.21%) Windows 10
7 2 (0.21%) Windows Server 2019
Processes & Methodologies
1 579 (60.95%) Cybersecurity
2 508 (53.47%) Information Security
3 264 (27.79%) Risk Management
4 238 (25.05%) Incident Response
5 202 (21.26%) Problem-Solving
6 188 (19.79%) SIEM
7 172 (18.11%) Security Architecture
8 157 (16.53%) Security Operations
9 155 (16.32%) Computer Science
10 139 (14.63%) Cloud Security
11 133 (14.00%) Vulnerability Management
12 125 (13.16%) Incident Management
13 109 (11.47%) ITIL
14 106 (11.16%) Application Security
15 104 (10.95%) Security Management
16 99 (10.42%) Roadmaps
17 89 (9.37%) Penetration Testing
18 81 (8.53%) Data Protection
19 79 (8.32%) Data Loss Prevention
20 77 (8.11%) Identity Access Management
Programming Languages
1 88 (9.26%) Python
2 50 (5.26%) PowerShell
3 19 (2.00%) Bash
4 14 (1.47%) SQL
5 10 (1.05%) Java
6 5 (0.53%) C
6 5 (0.53%) R
6 5 (0.53%) Scala
7 3 (0.32%) JavaScript
7 3 (0.32%) Kusto Query Language
8 2 (0.21%) C++
9 1 (0.11%) Groovy
9 1 (0.11%) Ruby
Qualifications
1 564 (59.37%) CISM
2 290 (30.53%) Degree
3 234 (24.63%) CISA
4 177 (18.63%) Cisco Certification
5 159 (16.74%) CRISC
6 152 (16.00%) Security Cleared
7 111 (11.68%) (ISC)2 CCSP
7 111 (11.68%) SC Cleared
8 103 (10.84%) CEH
9 96 (10.11%) CCSP
10 79 (8.32%) Computer Science Degree
11 73 (7.68%) CompTIA Security+
12 72 (7.58%) Azure Certification
13 67 (7.05%) CESG Certified Professional
14 65 (6.84%) AWS Certification
14 65 (6.84%) GIAC
15 57 (6.00%) CCNP
15 57 (6.00%) ISO 27001 Lead Auditor
16 56 (5.89%) Master's Degree
17 36 (3.79%) CCSK
Quality Assurance & Compliance
1 336 (35.37%) ISO/IEC 27001
2 278 (29.26%) NIST
3 120 (12.63%) GDPR
4 109 (11.47%) Cyber Essentials
5 102 (10.74%) PCI DSS
6 86 (9.05%) GRC
7 55 (5.79%) Cyber Essentials PLUS
8 50 (5.26%) NCSC
9 42 (4.42%) COBIT
10 30 (3.16%) ISO/IEC 27002 (supersedes ISO/IEC 17799)
11 28 (2.95%) NIST 800
12 21 (2.21%) SOC 2
13 17 (1.79%) HIPAA
14 15 (1.58%) QA
15 13 (1.37%) IASME
15 13 (1.37%) ISO 22301
15 13 (1.37%) JSP 440
16 12 (1.26%) HMG Security Policy Framework
16 12 (1.26%) RMADS
17 9 (0.95%) ISO/IEC 27005
System Software
1 47 (4.95%) Active Directory
2 24 (2.53%) Docker
3 7 (0.74%) VMware Infrastructure
4 6 (0.63%) Hyper-V
5 5 (0.53%) VMware NSX
6 3 (0.32%) Virtual Machines
7 2 (0.21%) VMware ESXi
8 1 (0.11%) OpenAM
8 1 (0.11%) OpenDJ
8 1 (0.11%) pfSense
8 1 (0.11%) Terminal Server
8 1 (0.11%) Virtual Desktop
Systems Management
1 40 (4.21%) Kubernetes
2 37 (3.89%) Single Sign-On
3 27 (2.84%) Ansible
4 19 (2.00%) CASB
5 12 (1.26%) Nessus
6 9 (0.95%) Computer Emergency Response Teams
7 6 (0.63%) Microsoft Intune
8 5 (0.53%) CSIRT
8 5 (0.53%) Grafana
8 5 (0.53%) Prometheus
8 5 (0.53%) SCOM
8 5 (0.53%) Suricata
9 3 (0.32%) FortiGate
9 3 (0.32%) QRadar
9 3 (0.32%) Terraform
10 1 (0.11%) Computer Incident Response Team
10 1 (0.11%) Failover Clustering
10 1 (0.11%) Nmap
10 1 (0.11%) RSA Archer
10 1 (0.11%) SCCM
Vendors
1 190 (20.00%) Microsoft
2 42 (4.42%) Cisco
3 34 (3.58%) Palo Alto
4 32 (3.37%) Splunk
5 29 (3.05%) CyberArk
6 25 (2.63%) Qualys
7 17 (1.79%) ArcSight
7 17 (1.79%) McAfee
8 16 (1.68%) Atlassian
8 16 (1.68%) Carbon Black
8 16 (1.68%) Meraki
9 15 (1.58%) Dell
10 14 (1.47%) VMware
11 13 (1.37%) Google
12 12 (1.26%) Citrix
13 11 (1.16%) Juniper
13 11 (1.16%) ServiceNow
14 10 (1.05%) Fortinet
15 9 (0.95%) Aruba
15 9 (0.95%) CheckPoint